# Loading the packages
library(magrittr)
library(tidyverse)
library(scales)
library(ggthemr)
library(knitr)
library(kableExtra)
library(lubridate)

# load the data
Movie <- movie_profit <- read_csv("movie_profit.csv",
                                  col_types = cols(...1 = col_skip(), release_date = col_date(format = "%m/%d/%Y")))

# Load the theme
ggthemr("flat dark")

# looking at dimensions
dim(Movie)
attach(Movie)Week 30: Movie Profit
Movie Profit, Not So Profit
This is my first post on Tidy Tuesday and the data-set in question is Movie profit data-set. Even though the title of data says Movie profit I am going to focus on the movies which did not generate any revenue domestic and suggest on gross in worldwide.
The packages that I have used here are magrittr, tidyverse, scales, ggthemr, knitr, kableExtra, ggthemr and lubridate. The theme I am using for plots is “flat dark”.
Understand Genre and Mpaa Rating on Movies
3401 movies with 8 variables of information which include numeric and categorical. There are 202 distributors for movies of four types of ratings which are G, PG, PG-13 and R, but 137 movies have no record of them. Also there are five categories for genre, where Drama with 1236, while horror with 298 movies.
# Bar plot to Genre
ggplot(Movie,aes(genre))+
  geom_bar()+stat_count(aes(y=..count.., label=..count..), geom="text", vjust=-.5)+
  xlab("Genre")+ylab("Frequency")+
  ggtitle("All movies in perspevtive of Genre ")
There are five types of ratings but around half of them are R rated, while 1094 are PG-13. While 573 are in category of PG and G rated movies are only 85. Finally, 137 movies do not have any ratings.
# Bar plot to MPAA Ratings
ggplot(Movie,aes(mpaa_rating))+
  geom_bar()+geom_bar()+
  stat_count(aes(y=..count.., label=..count..),geom="text", vjust=-.5)+
  xlab("Rating")+ylab("Frequency")+
  ggtitle("All movies in persepvtie of MPAA Rating")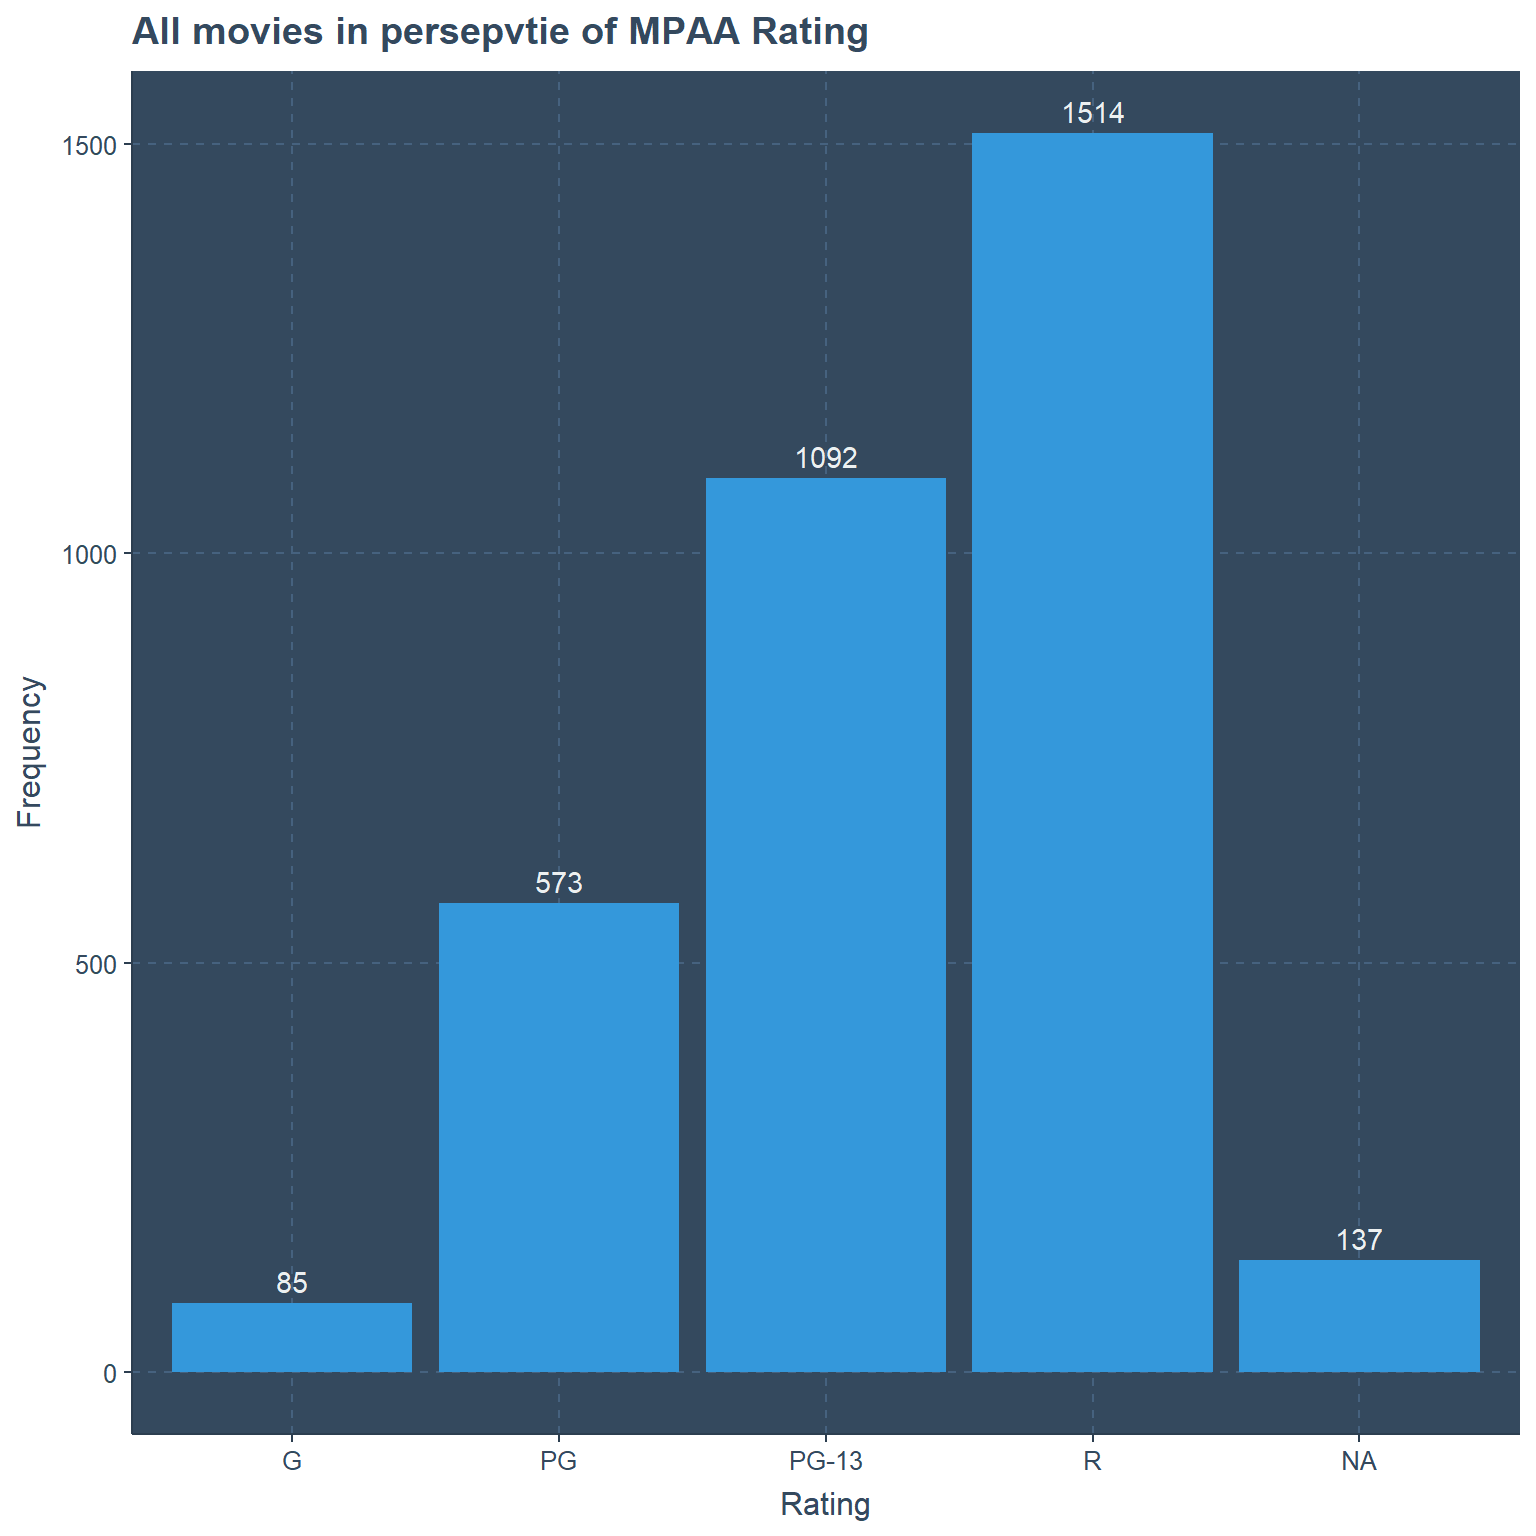
Comedy movies are mostly R rated(under 17 requires guardian) and PG-13 (some material is inappropriate to under 13). Where the frequencies are respectively 367 and 328. 309 movies of adventure genre could be watched by children with accompanying parents and 67 movies can be watched by all ages.
Yet 645 Drama movies are R-rated.There is only one action movie for general audiences(for all) and obviously no horror film should be watched by children alone, yet there are 7 movies which you can watch with your parents.
#checking for bias in mpaa rating and genre
kable(table(mpaa_rating,genre),"html") %>%
kable_styling(bootstrap_options = c("striped"),full_width = T) %>%
add_header_above(c("Contingency table in counts for Genre versus MPAA Rating"=6)) | Action | Adventure | Comedy | Drama | Horror | |
|---|---|---|---|---|---|
| G | 1 | 67 | 6 | 11 | 0 |
| PG | 34 | 309 | 79 | 144 | 7 |
| PG-13 | 225 | 83 | 328 | 398 | 58 |
| R | 286 | 14 | 367 | 645 | 202 |
We think horror movies are mostly R-rated then it is true. But only it is explainable by percentage. Yet considering the amount of horror movies made generally it is very low even in this random sample. Action and Comedy movies have very close percentages for PG-13 ratedness, while 52% are R rated for Action and 47% are comedy.
# column percentage for above table
kable(table(mpaa_rating,genre) %>%
    prop.table(margin=2) %>%
    round(digits = 2)) %>%
    kable_styling(bootstrap_options = c("striped"),full_width = T) %>%
add_header_above(c("Percentage table for Genre versus MPAA Rating"=6))| Action | Adventure | Comedy | Drama | Horror | |
|---|---|---|---|---|---|
| G | 0.00 | 0.14 | 0.01 | 0.01 | 0.00 |
| PG | 0.06 | 0.65 | 0.10 | 0.12 | 0.03 |
| PG-13 | 0.41 | 0.18 | 0.42 | 0.33 | 0.22 |
| R | 0.52 | 0.03 | 0.47 | 0.54 | 0.76 |
This data-set contains the release dates from 1956 to 2019. Even though it is not 2019 there is a movie which has been listed here. This explains the domestic and worldwide gross being zero as zero. Then again we have to be careful because there are movies which might not make profit at all, domestic or other wise.
Lets Focus of movies which has zero domestic gross
No revenue from 66 movies, that is interesting. So obviously Aqua man has a whopping more than 150 million dollars
production budget and no profit because it was not released yet when this data set was compiled. Second rank is for “Wonder park” with 100 million dollars. This movie will be released in 2019.
Zero Domestic gross Point of View
Surprisingly there are movies without any production budget information because I am very sure No movie is done for free. Specially it is odd to see “12 Angry Men” in this list, which leads to the conclusion not all Movies in this list are to be on-it in the first place. We have 66 movies to consider.
# domestic gross zero only movies
Movie_domestic_zero<-subset.data.frame(Movie,c(domestic_gross==0))
# checking dimensions
dim(Movie_domestic_zero)
attach(Movie_domestic_zero)
# Scatterplot for production budget
ggplot(Movie_domestic_zero,aes(x=reorder(movie,production_budget),
y=production_budget))+
geom_point()+theme(axis.text.x =element_text(angle = 90, hjust = 1))+
scale_y_continuous(labels = dollar_format())+
ylab("Production budget")+xlab("Movie names")+
ggtitle("Domestic Gross Zero but how production budget varies in Movies")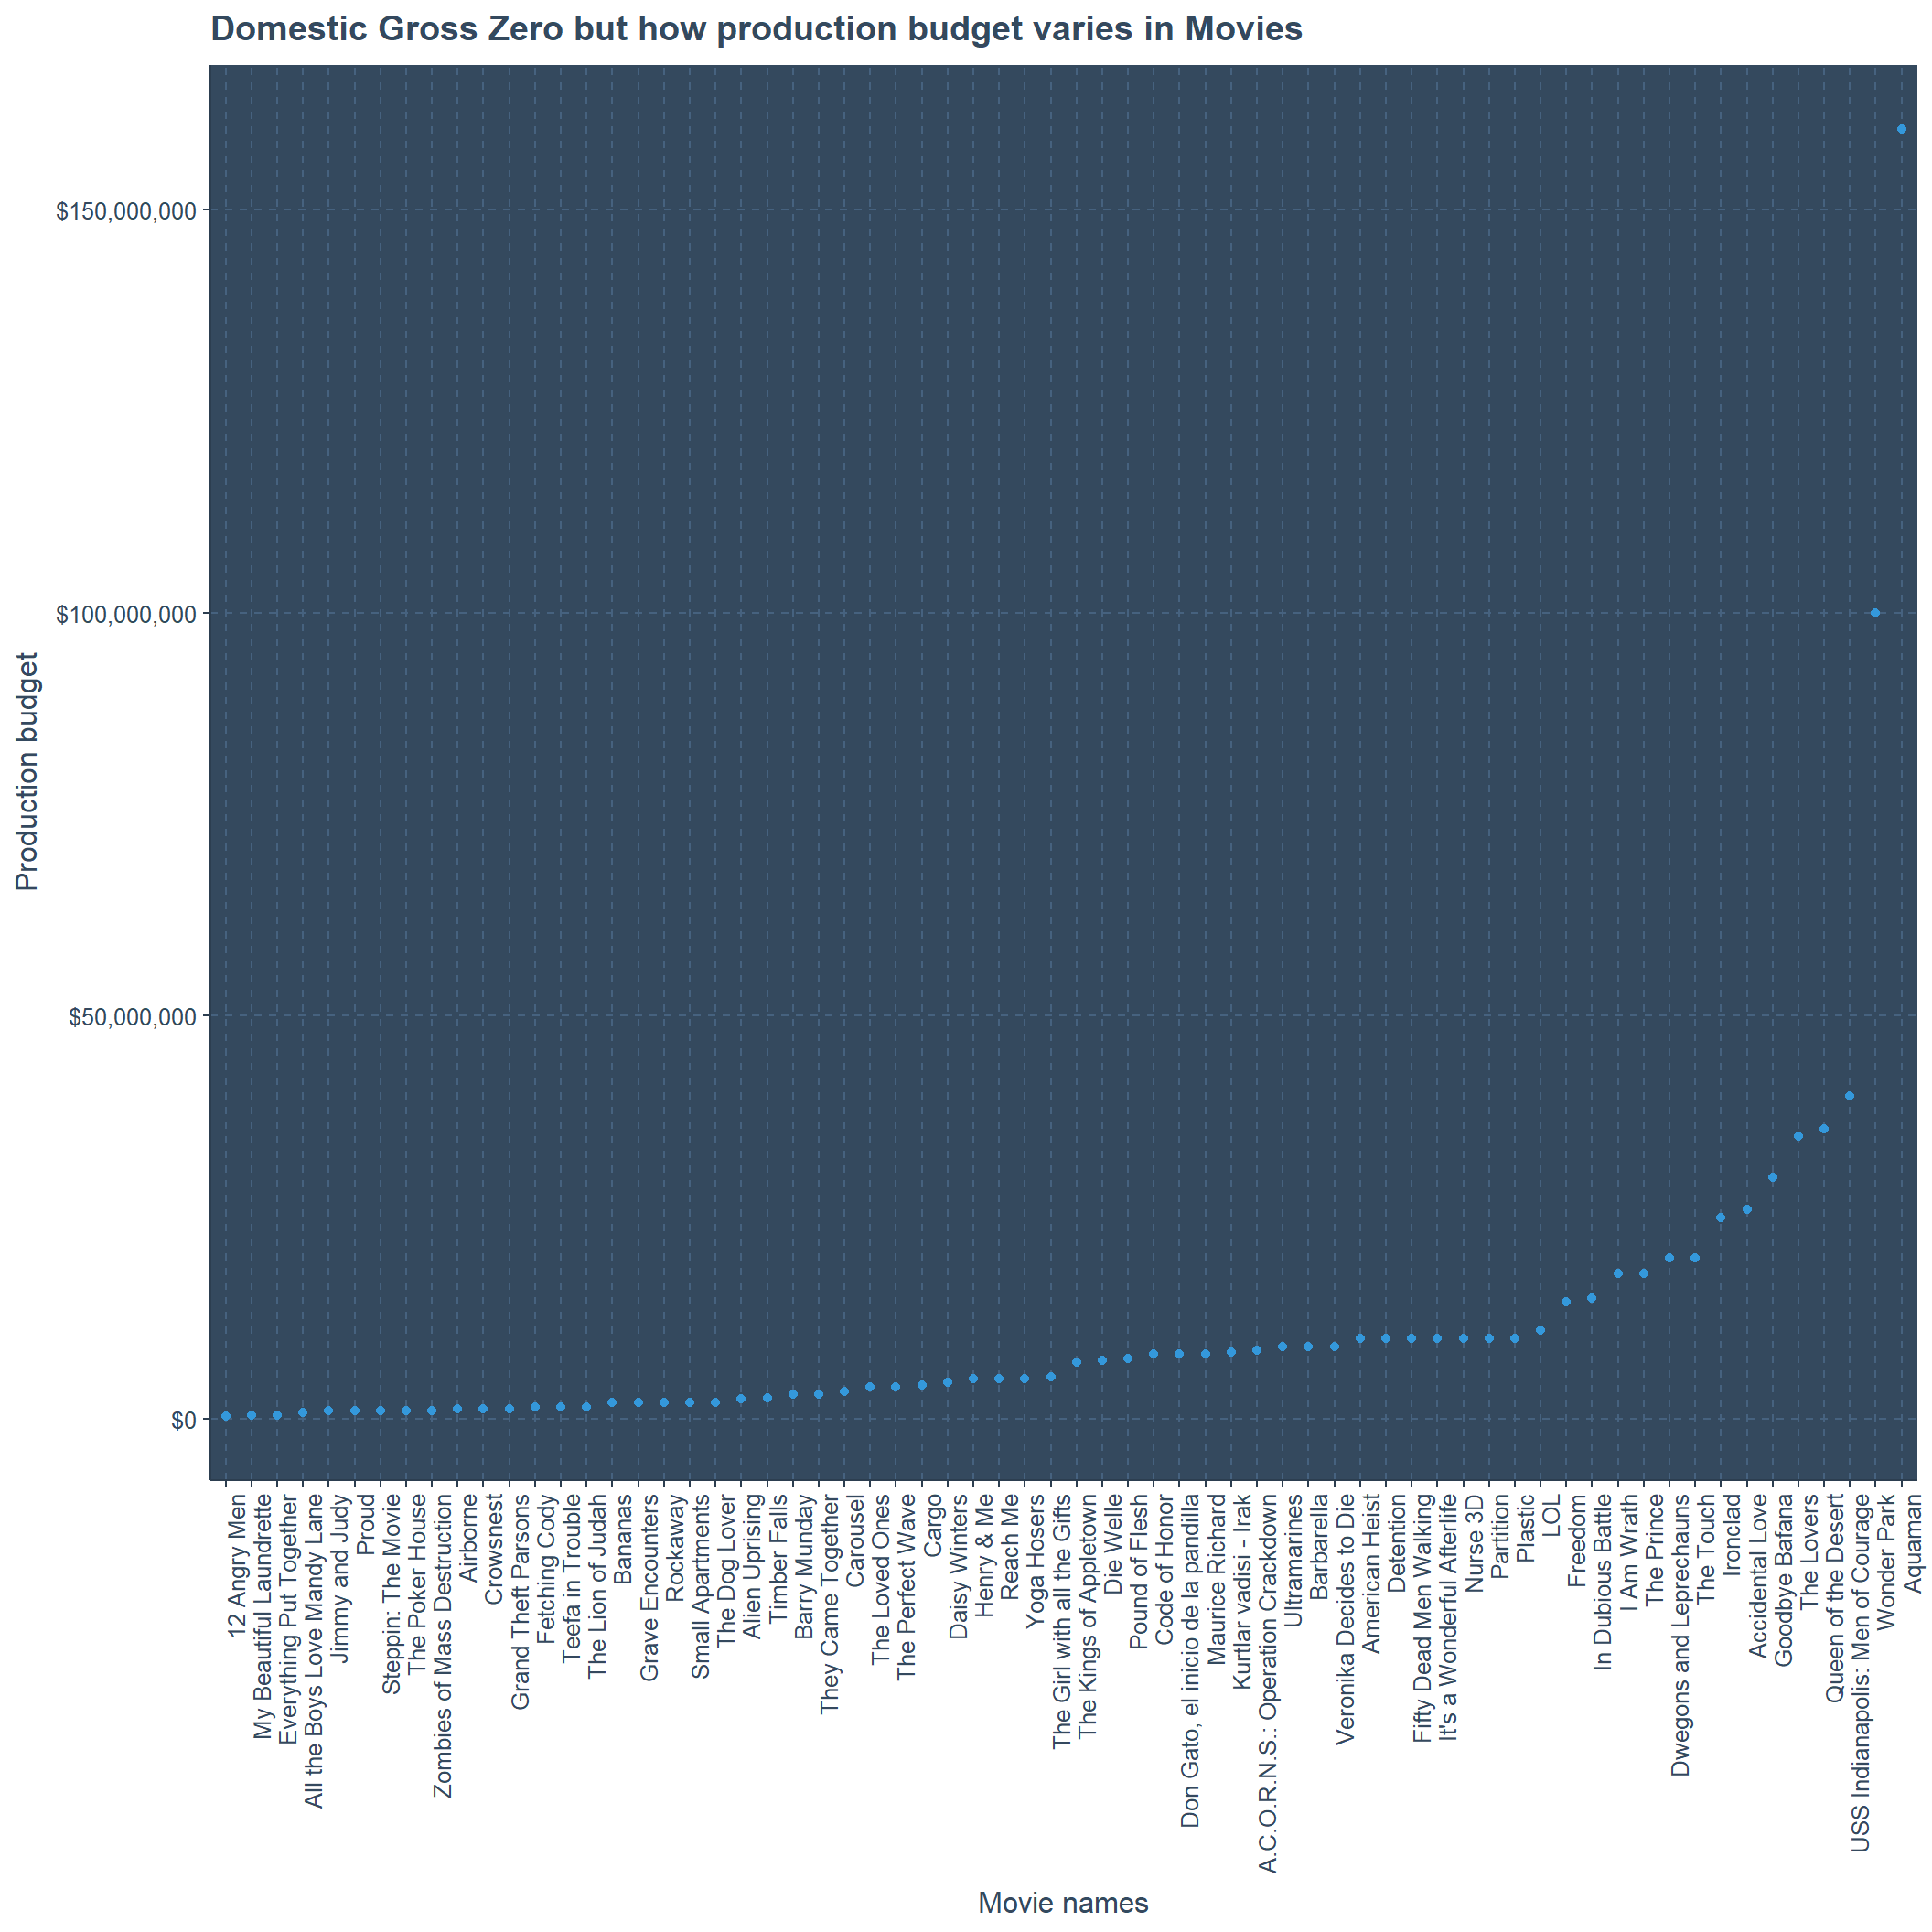
Genre and MPAA Rating Point of View
So movies with R ratedness have the most count and they are also action and drama genre movies of count 10. Here also there are 11 movies with have not been classified into any rating. Finally, there is no G rated movie in this graphical representation. Majority of movies (31) are from R rated in related to rating. While considering genre the Drama category is represented by 24. Action, Drama and Horror movies includes missing rating.
#plotting worldwide gross with genre
Movie_domestic_zero %>%
  ggplot(aes(x=mpaa_rating,fill=genre)) +
  geom_bar(position = "stack")+ylab("Frequency")+xlab("MPAA Rating")+
  geom_text(aes(label=..count..),stat='count',position=position_stack(0.4))+
  ggtitle("MPAA Rating counts with Genre")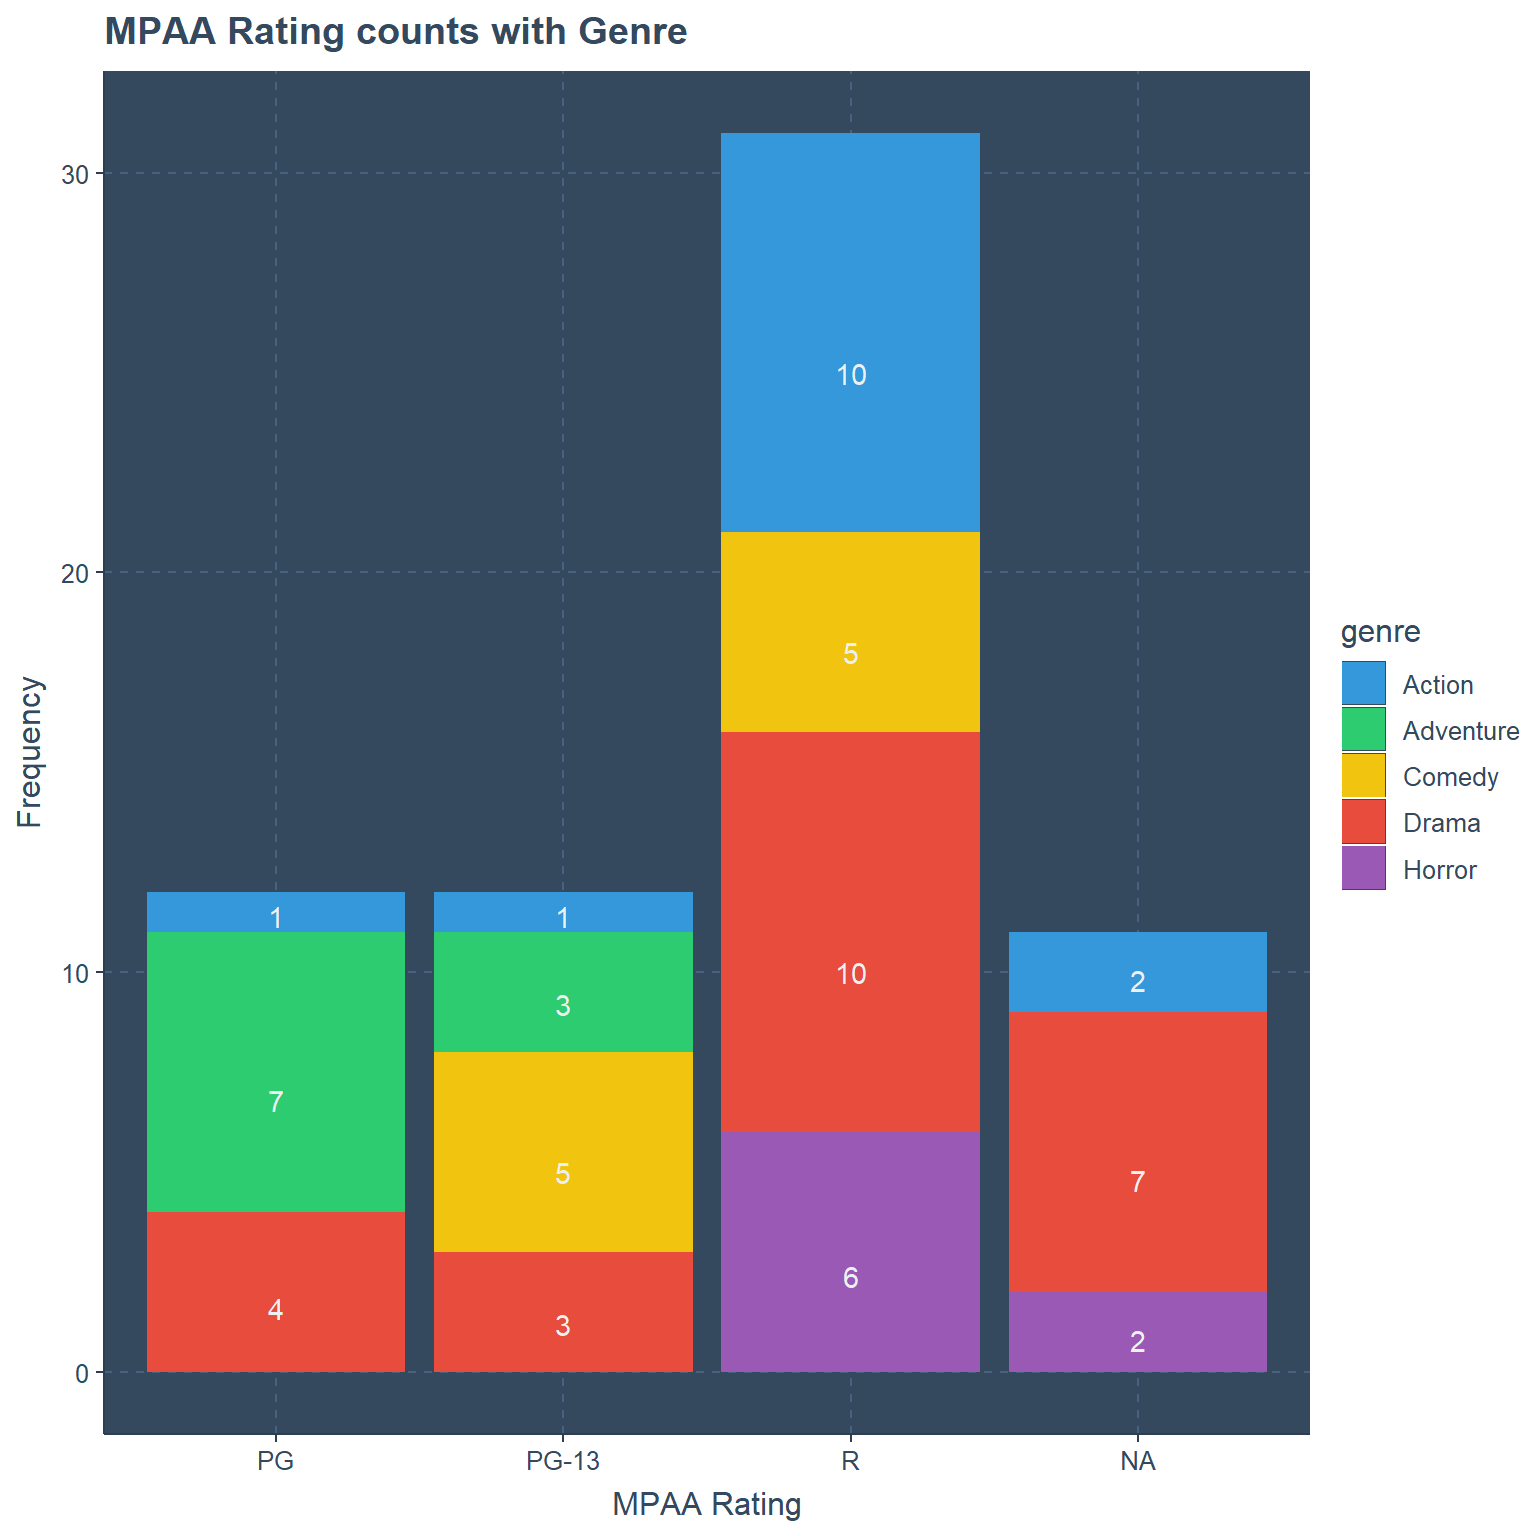
#plotting worldwide gross with mpaa rating
Movie_domestic_zero %>%
  ggplot(aes(fill=mpaa_rating,x=genre)) +
  geom_bar(position = "stack")+ylab("Frequency")+xlab("Genre")+
  geom_text(aes(label=..count..),stat='count',position=position_stack(0.4))+
  ggtitle("Genre counts with MPAA Rating")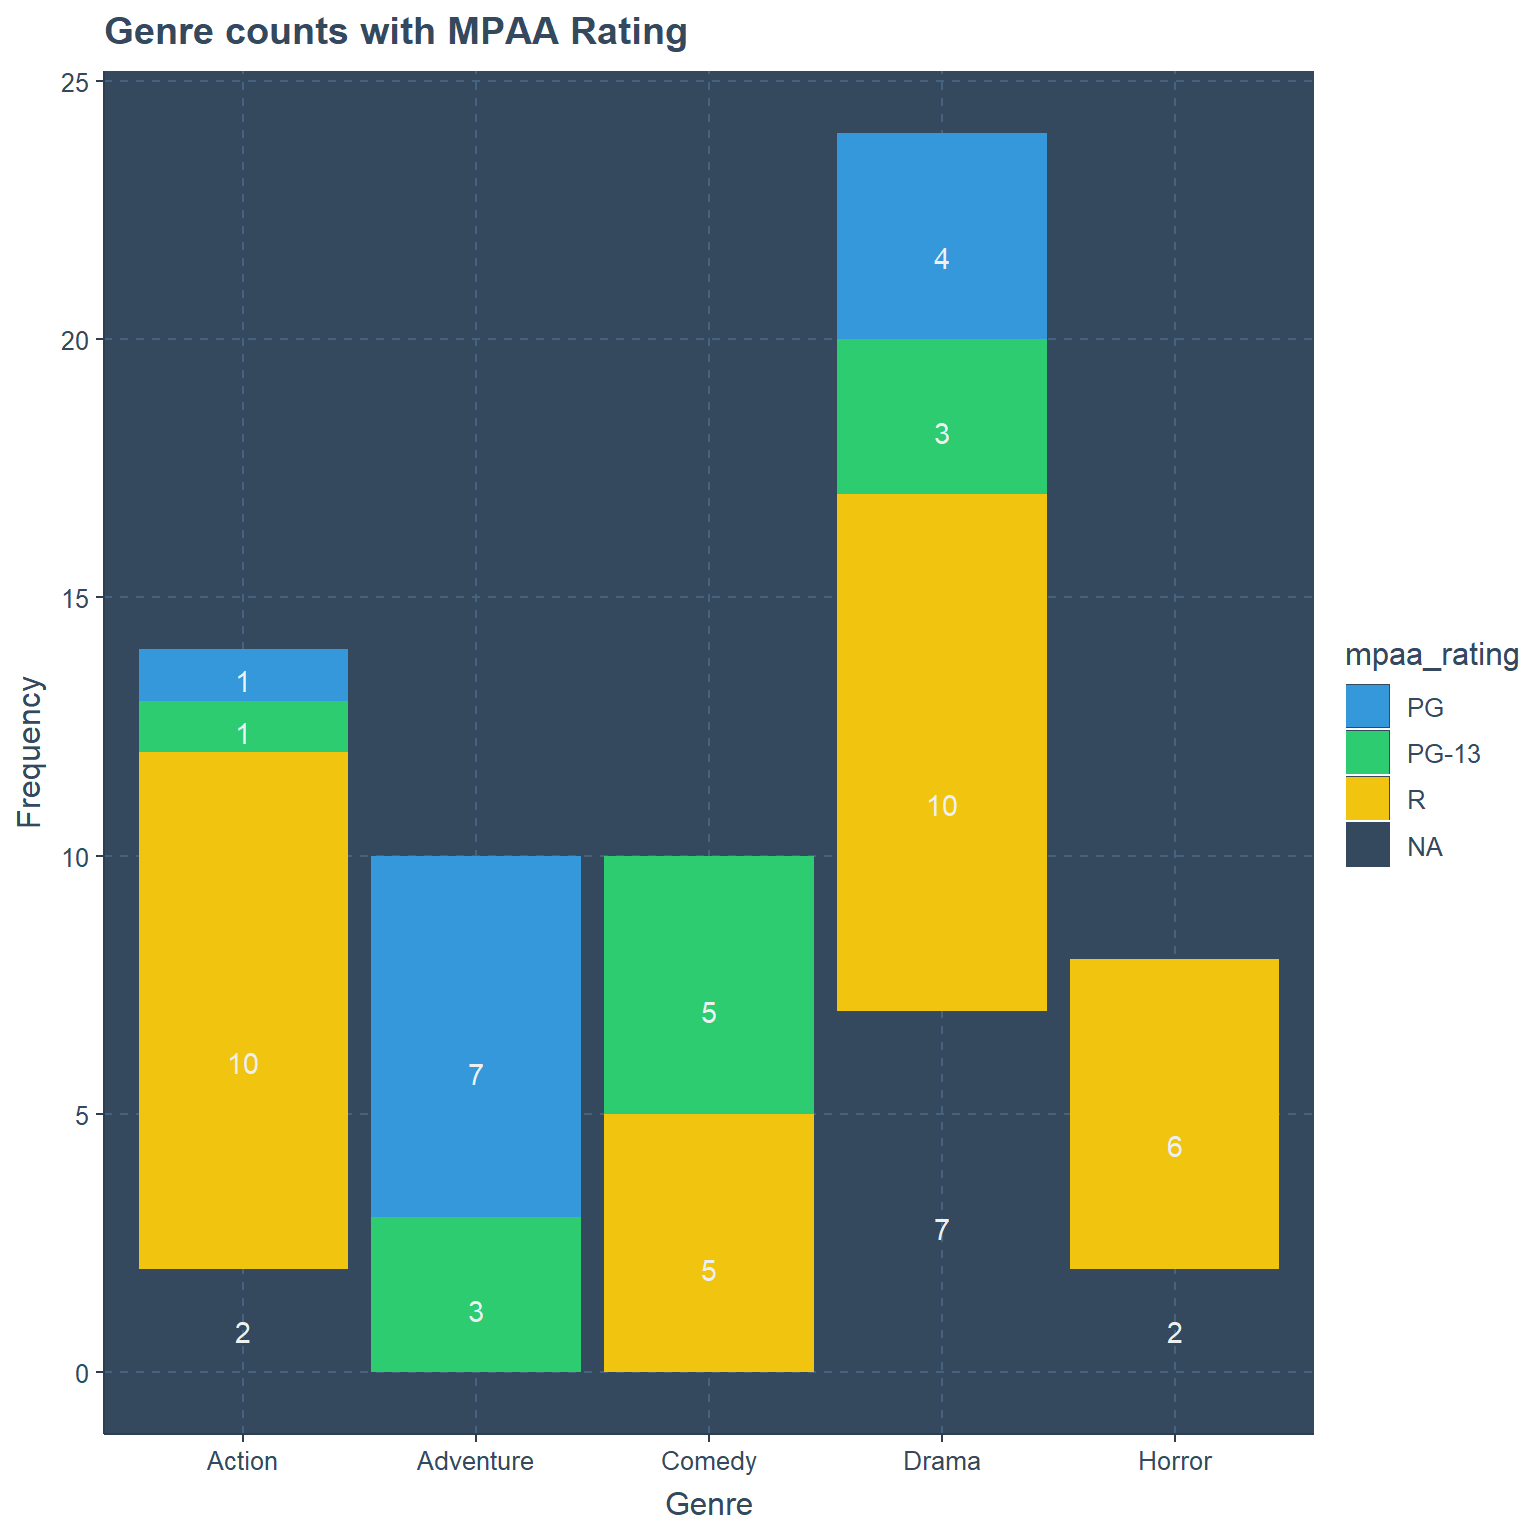
Finding Outliers in Perspective of Genre and MPAA Rating
Considering the box-plot there are 3 outliers in Drama while plotting data in perspective of genre. Most amount of production budget is concluded in Action genre, while the least is in Horror.
If we focus on the production budget with genre there are 7 outliers and one action movie has spent 100 million dollars, similarly a movie from adventure category spent more than 100 million dollars. Others production budget is way less than 50 million dollars.
#plotting production budget with genre
Movie_domestic_zero %>%
  ggplot(aes(genre,production_budget)) +
  geom_boxplot()+ylab("Production Budget")+
  xlab("Genre")+
  scale_y_continuous(labels = dollar_format())+
  expand_limits(y=0)+coord_flip()+
  ggtitle("Boxplot for Production budget in perspective of Genre")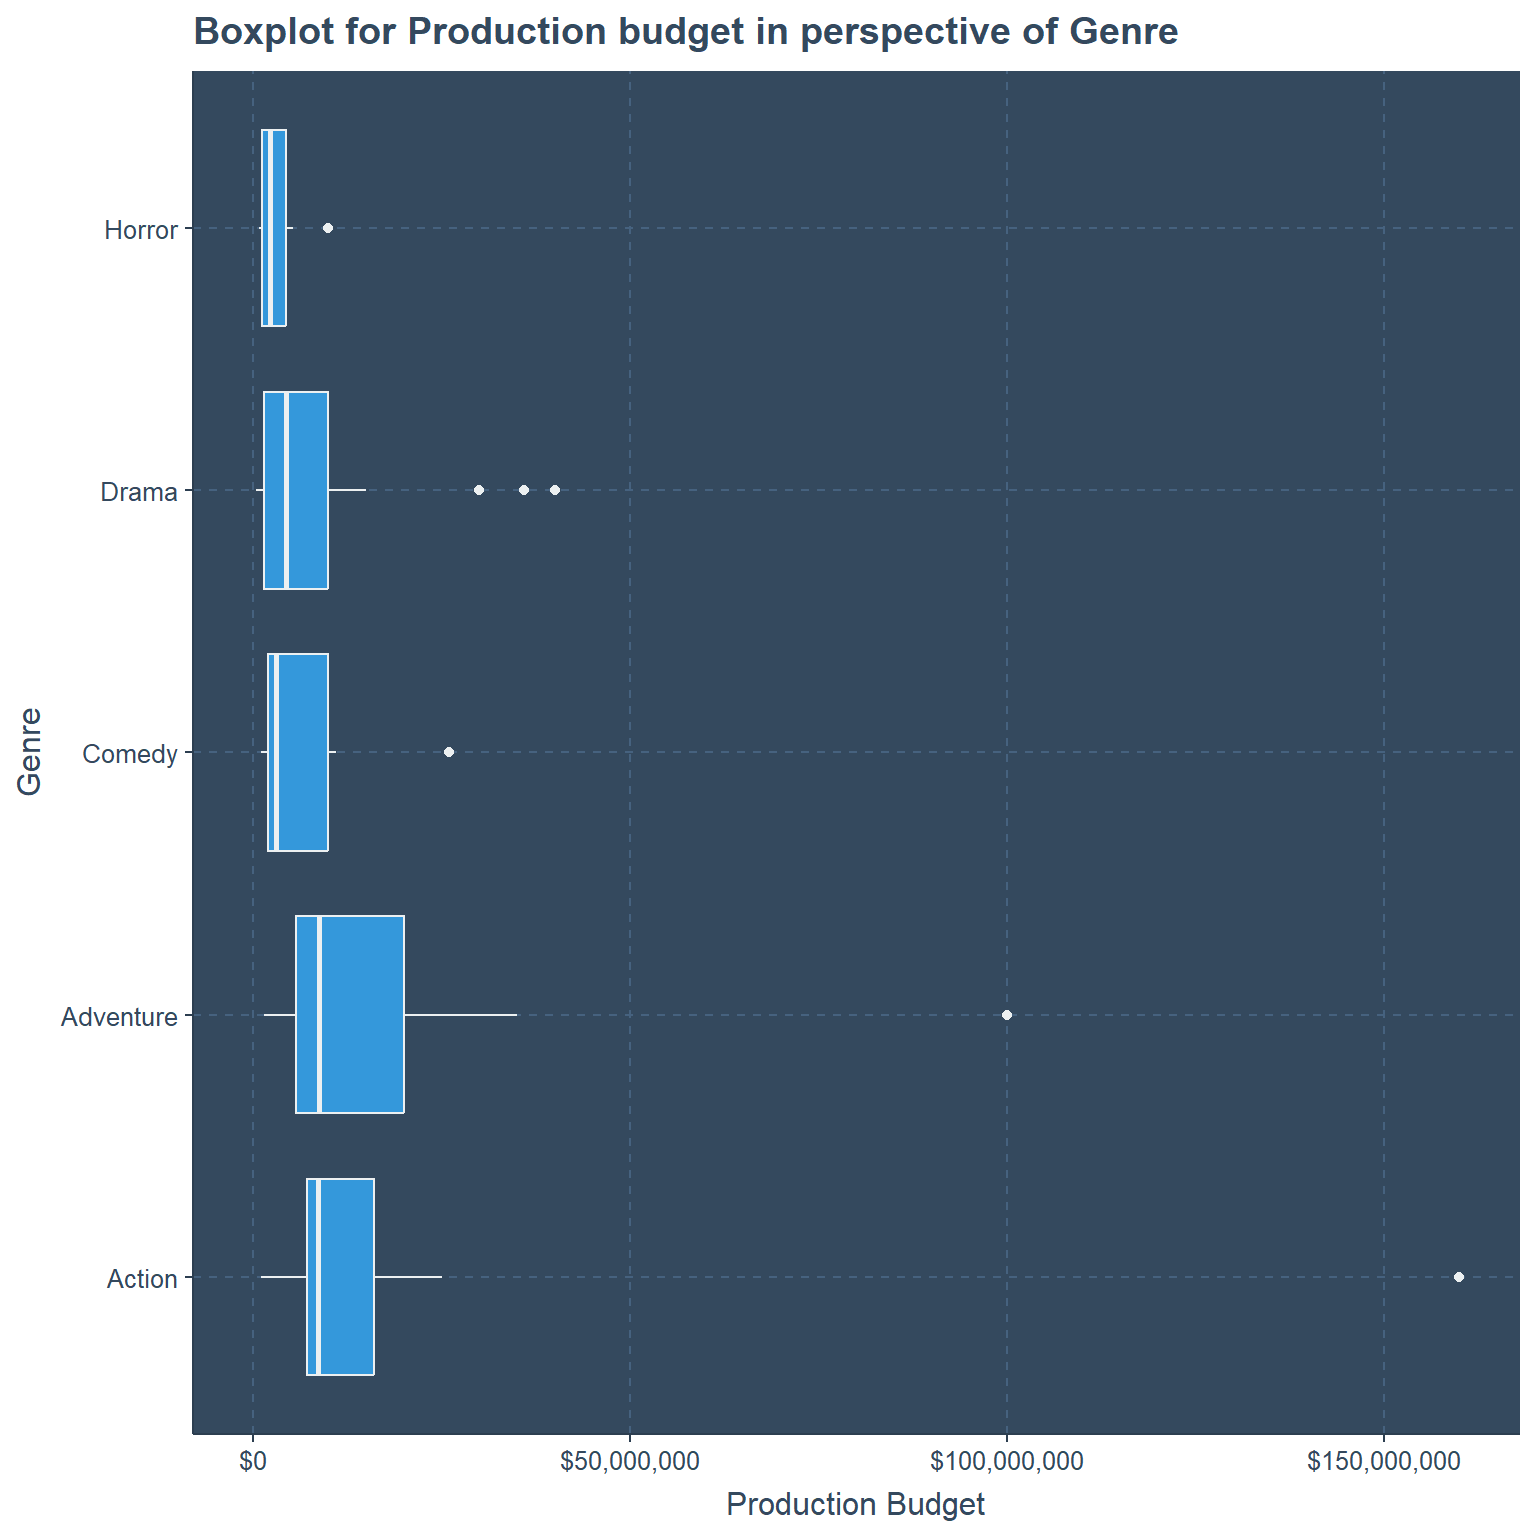
Least amount budget is spent on movies of no rating mentioned while most is on PG-13 rated movies and it has one strong outlier. Previously with genre we had 7 outliers but according to MPAA rating there are only 6 outliers.
#plotting production budget with genre
Movie_domestic_zero %>%
  ggplot(aes(mpaa_rating,production_budget)) +
  geom_boxplot()+ylab("Production Budget")+
  xlab("MPAA rating")+
  scale_y_continuous(labels = dollar_format())+
  expand_limits(y=0)+coord_flip()+
  ggtitle("Boxplot for Production budget in perspective of MPAA Rating")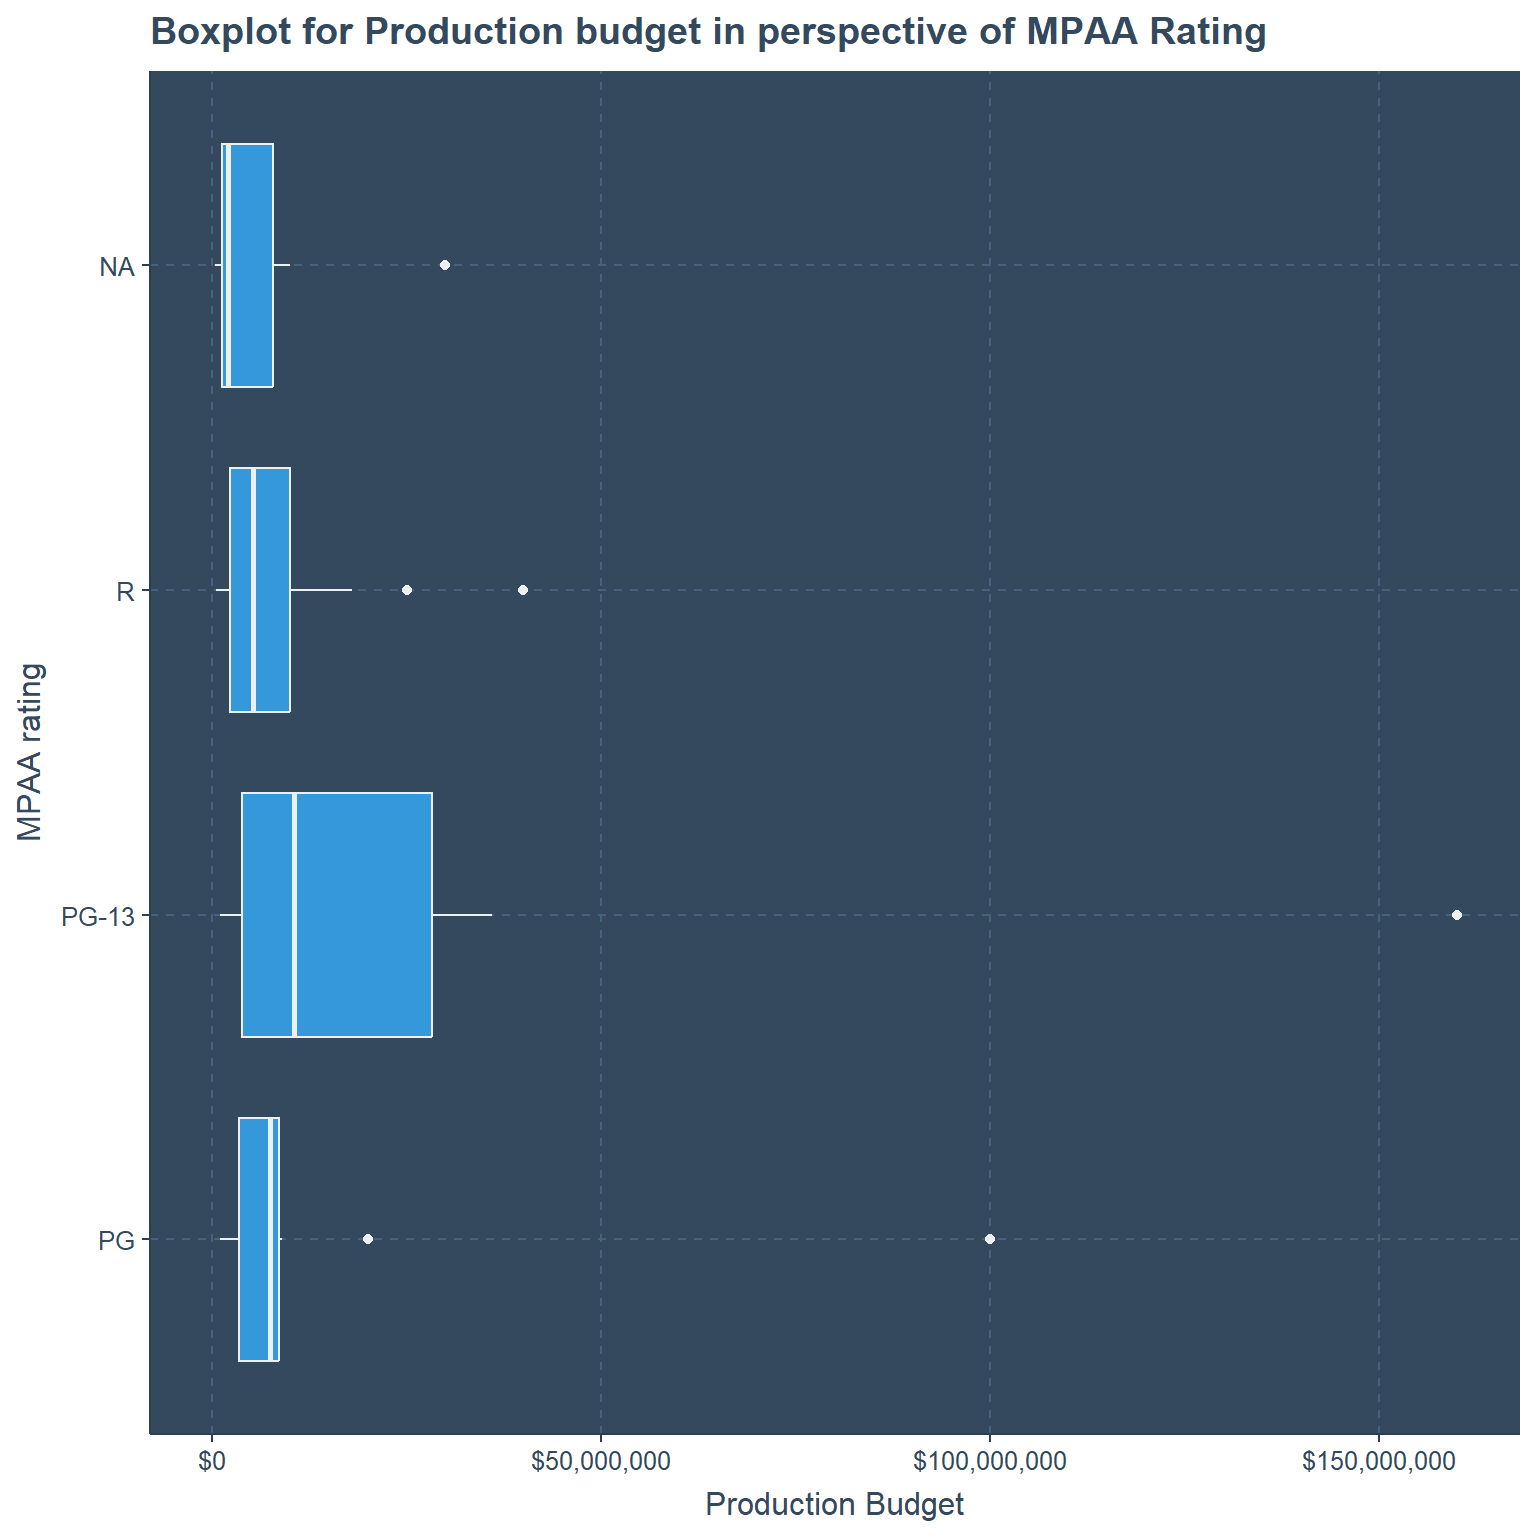
Production Budget and Worldwide Gross
According to the ascending order in the list of 10 movies with lowest production budget only 2 have profited. One movie (All the Boys Love Mandy Lane) has considerably done good, but if you consider this list of 10 movies we have 12 angry men as well.
# ascending order of top ten movies in production budget
kable(Movie_domestic_zero[order(Movie_domestic_zero$production_budget),-c(1,4)] %>%
      head(10),
      col.names=c("Movie Name","Production Budget","Wordlwide Gross","Distributor",
                  "MPAA Rating","Genre")) %>%
kable_styling(full_width = T,font_size = 13) %>%
add_header_above(c("Top 10 Least production budget movies for Domestic gross 0"=6))| Movie Name | Production Budget | Wordlwide Gross | Distributor | MPAA Rating | Genre |
|---|---|---|---|---|---|
| 12 Angry Men | 340000 | 0 | United Artists | NA | Drama |
| My Beautiful Laundrette | 400000 | 0 | Orion Classics | NA | Drama |
| Everything Put Together | 500000 | 7890 | NA | R | Drama |
| All the Boys Love Mandy Lane | 750000 | 1960521 | Radius | R | Horror |
| Jimmy and Judy | 1000000 | 0 | Outrider Pictures | R | Action |
| The Poker House | 1000000 | 0 | Phase 4 Films | R | Drama |
| Proud | 1000000 | 0 | Castle Hill Product… | PG | Drama |
| Steppin: The Movie | 1000000 | 0 | Weinstein Co. | PG-13 | Comedy |
| Zombies of Mass Destruction | 1000000 | 0 | After Dark | R | Comedy |
| Grand Theft Parsons | 1200000 | 0 | Swipe Films | PG-13 | Drama |
This indicates that we didn’t have records how much of profit in home and away properly, because there is no way that people did not watch that movie and not make any gross. So we conclude that some movies which were released before 1970s did not pertain any information of gross domestic or worldwide.
Years, Months and Days versus Production Budget
There are 4 Movies before 1972 with zero for domestic gross which can conclude loss of information. Oddly in year 2014 there are 8 movies with zero domestic gross and most of the movies are after year 2000.
# plotting years vs movies released
ggplot(Movie_domestic_zero,aes(x=year(release_date)))+
      geom_bar()+ylab("Frequency")+xlab("Years")+
      scale_x_continuous(label=1956:2019,breaks=1956:2019)+
      scale_y_continuous(labels = 0:8,breaks = 0:8)+
      stat_count(aes(y=..count.., label=..count..), geom="text", vjust=-.5)+
      theme(axis.text.x = element_text(angle = 90,hjust = 2))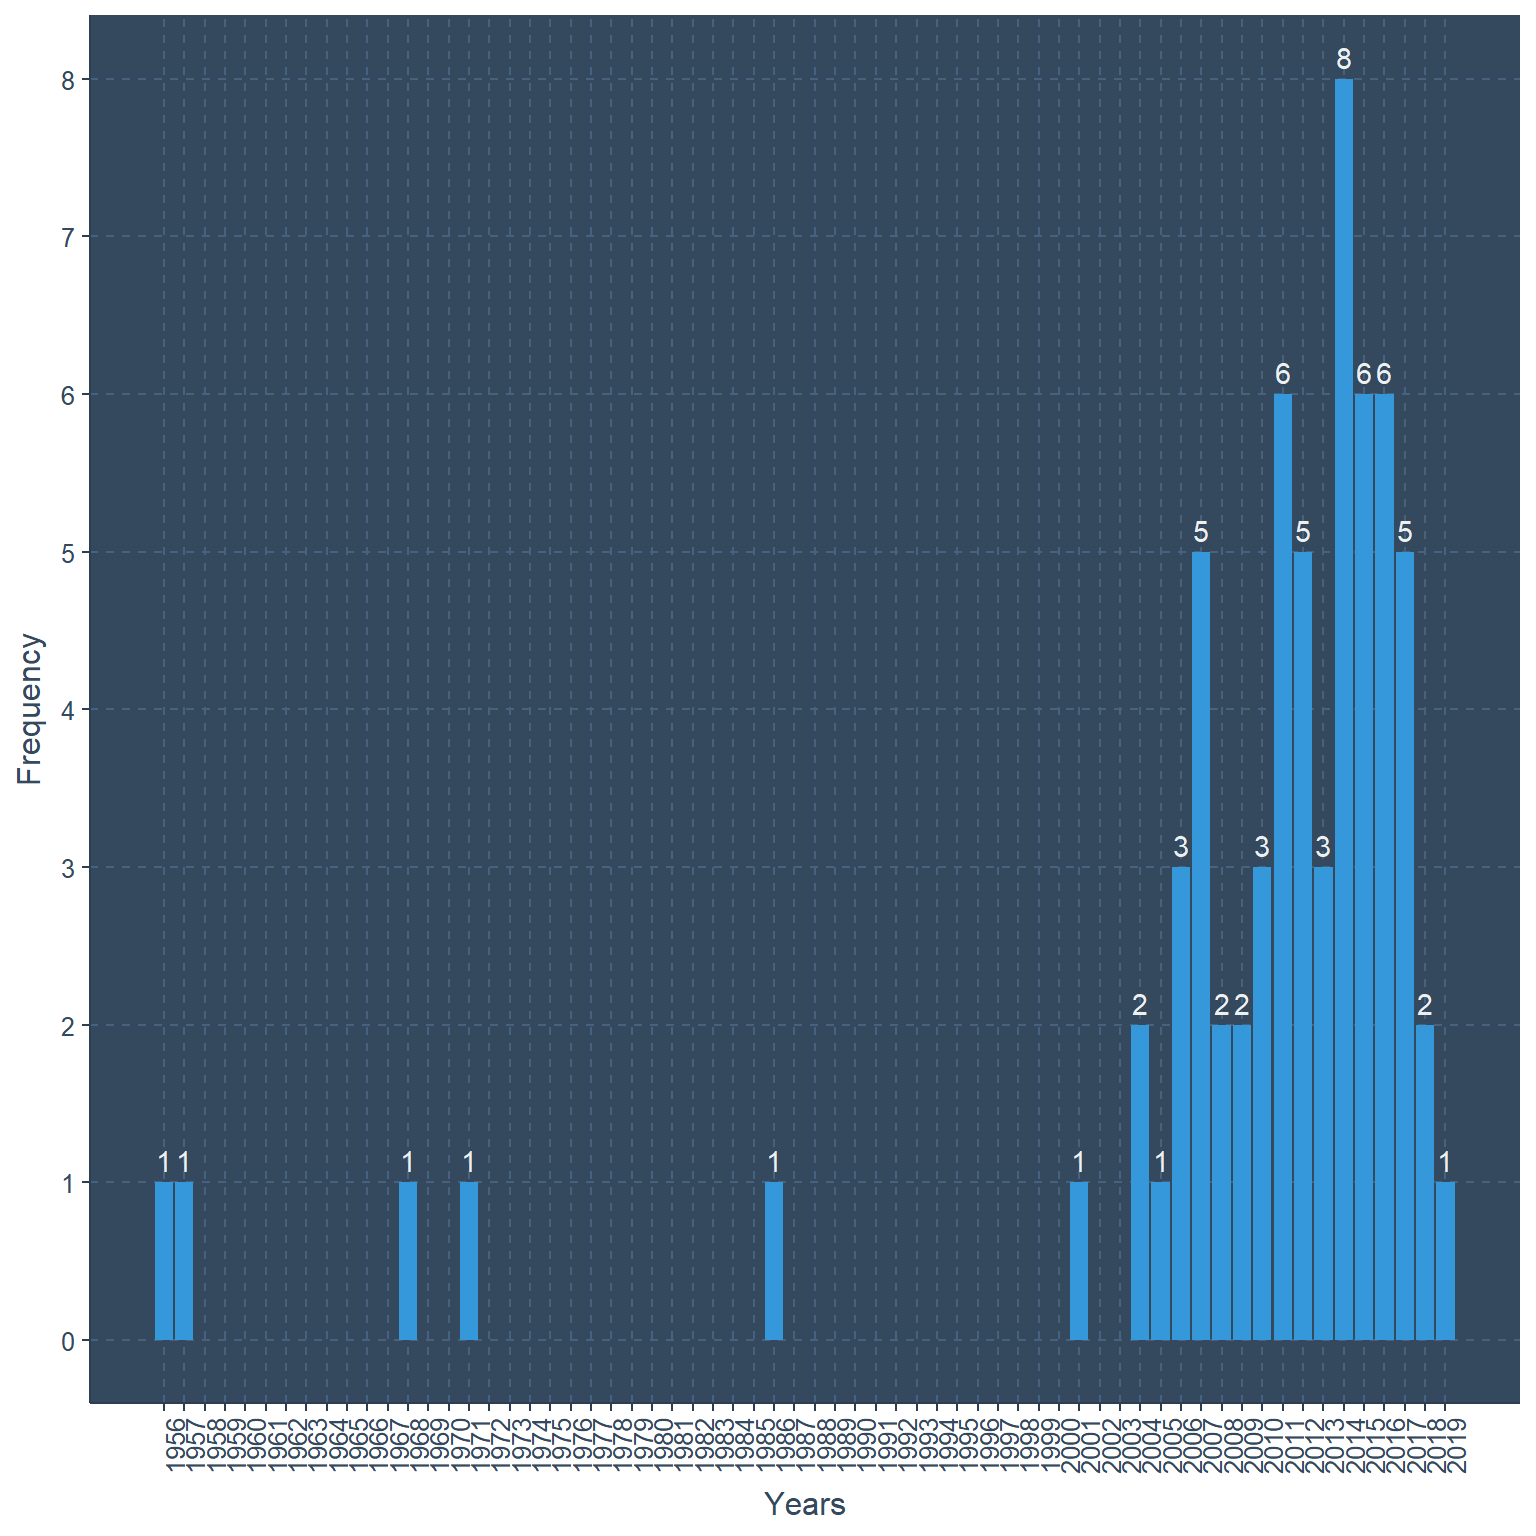
Considering the months there is no specialty most of the counts are in-between 3 and 8. In January there are only two movies.
ggplot(Movie_domestic_zero,aes(x=month(release_date)))+
      geom_bar()+ylab("Frequency")+xlab("Months")+
      scale_x_continuous(label=1:12,breaks=1:12)+
      scale_y_continuous(labels = 0:8,breaks = 0:8)+
      stat_count(aes(y=..count.., label=..count..), geom="text", vjust=-.5)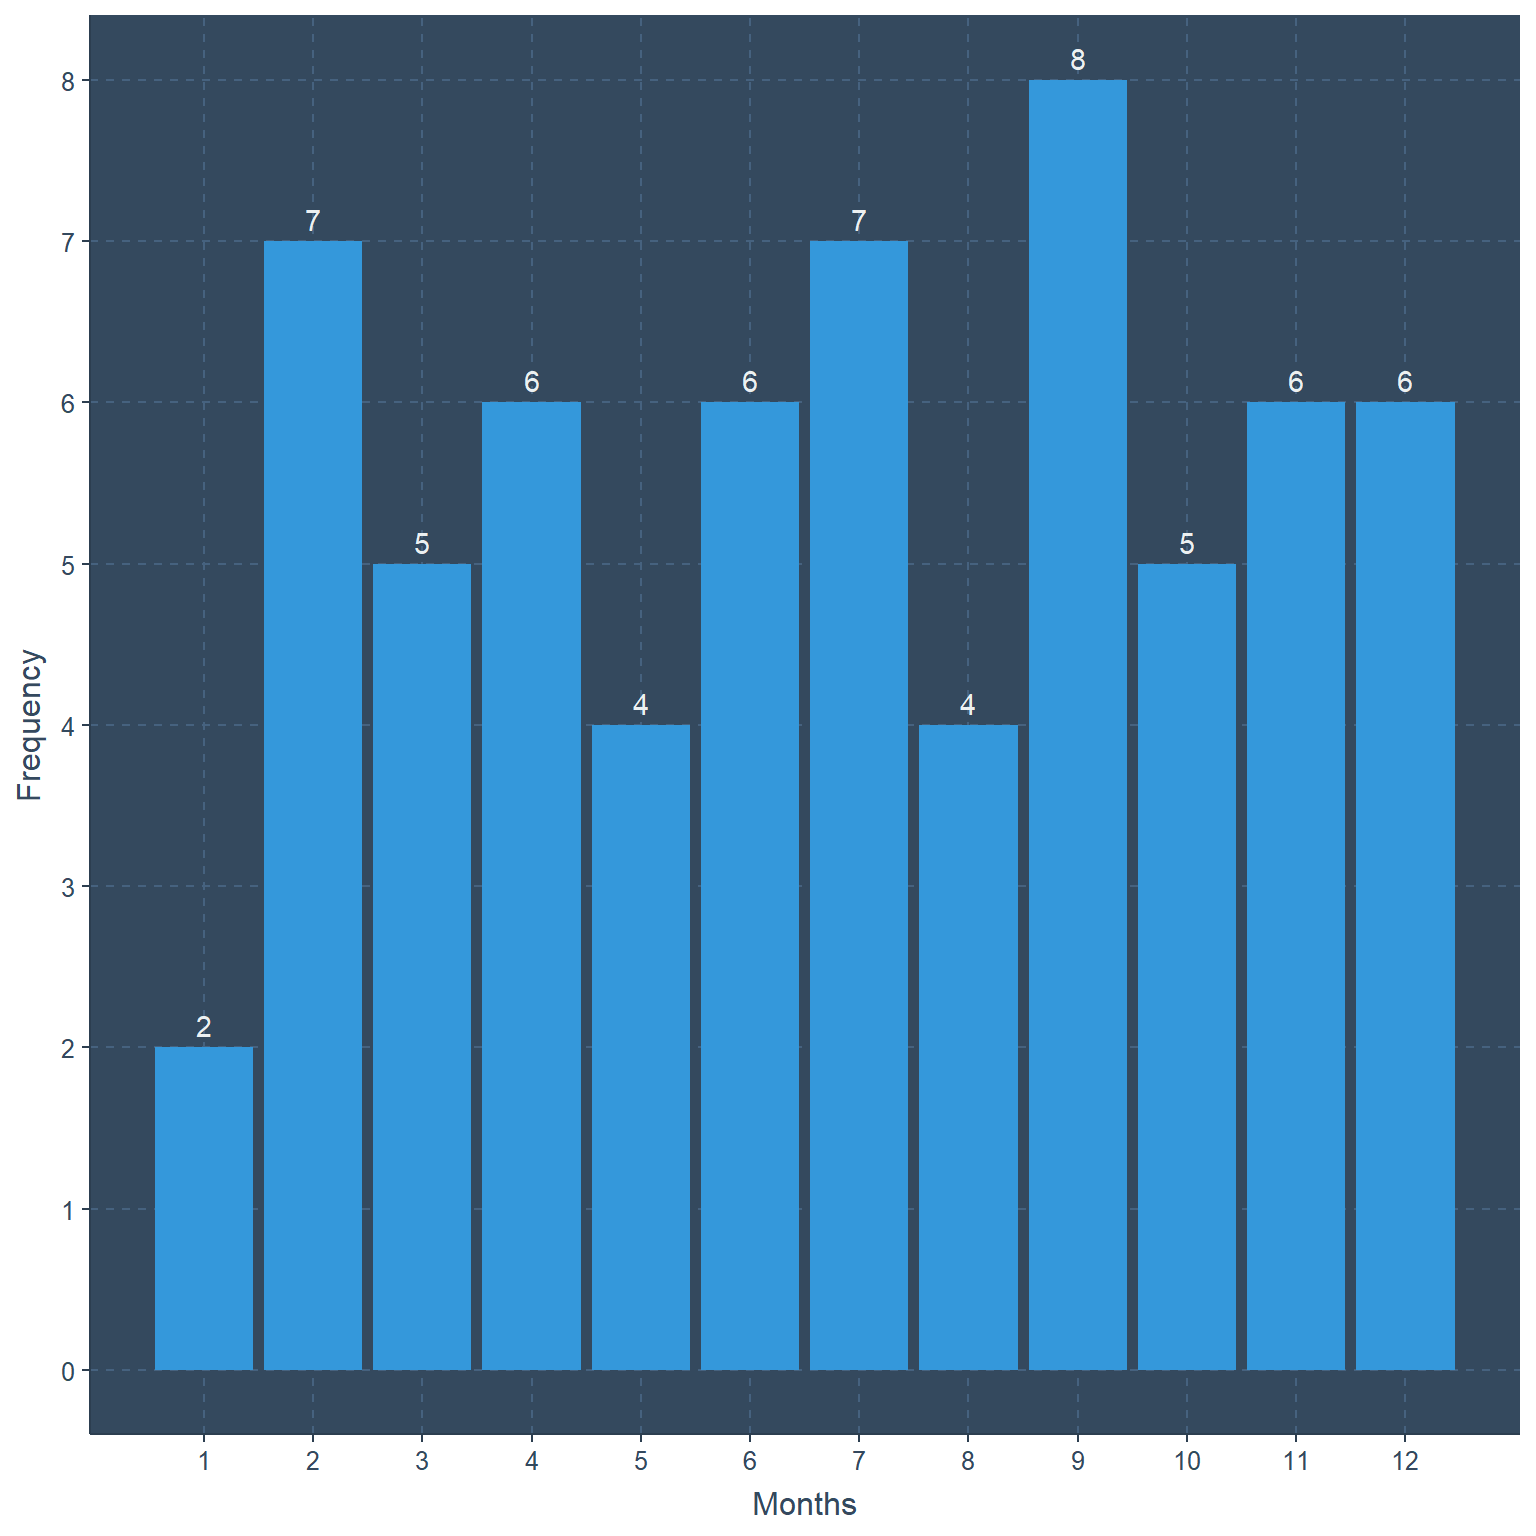
Only the movies with release dates 19th and 25th have no domestic gross, while highest count of 6 occurs on 21st. Most of the days have the count of 1 movie.
ggplot(Movie_domestic_zero,aes(x=day(release_date)))+
      geom_bar()+ylab("Frequency")+xlab("Days")+
      scale_x_continuous(label=1:31,breaks=1:31)+
      scale_y_continuous(labels = 0:6,breaks = 0:6)+
      stat_count(aes(y=..count.., label=..count..), geom="text", vjust=-.5)
Conclusion
My conclusion of the above plots and tables in point form
In the complete data set Drama Genre has most (1236) counts and least (298) count goes to Horror. While, most (1514) of the Movies are R rated, least count goes to Grated movies. Considering Genre and Rating, it is true that Horror movies are R rated while it represents 76%, and should not let children watch alone.
While there are movies with No domestic gross some have not been released yet (Aqua man and Wonder Park). Further, some Movies do not even have worldwide gross. This causes missing information. Even though a famous movies such as “12 Angry Men”.
This missing information could be the related to the fact that there are 4 movies which were released before 1972. Oddly in 2014 there are 8 movies which do not contain domestic gross information. Further, most of these movies were released after year 2000.
Box plot indicates Adventure genre have spent more range in production budget, while in perspective of MPAA rating PG-13 movies have most range in production budget with a clear outlier.
Further Analysis
Similarly we can focus on movies of world wide gross equals to zero with other variables.
Conduct scrutinized interest with movies of world wide gross zero and domestic gross zero.
Please see that This is my first post on the internet so please be kind to tolerate my mistakes in grammar and spellings. I intend to post more statistics related materials in the future and learn accordingly. Thank you for reading.
THANK YOU