{{% tweet "1103226092352139264" %}}
Week 10: Women in Workforce
TidyTuesday
2019
Earnings Female
All other age groups
average<-earnings_female %>%
         filter(group=="Total, 16 years and older") %>%
         mutate(year=cut(Year,breaks = c(1978,1989,1999,2011),
                  labels =c("1980s","1990s","2000s") ) ) %>%
        group_by(year) %>%
        summarize(Mean=mean(percent))

earnings_female %>%
  filter(group!="Total, 16 years and older") %>%
ggplot(.,aes(Year,percent,color=group))+
  geom_point()+geom_line()+
  theme(legend.position = "bottom")+
  geom_hline(yintercept = average$Mean,color=c("red","maroon","brown"),size=1.2)+
  annotate("text",x=2010,y=68,label="1980s Average")+
  annotate("text",x=1983,y=76,label="1990s Average")+
  annotate("text",x=2008,y=80.5,label="2000s Average")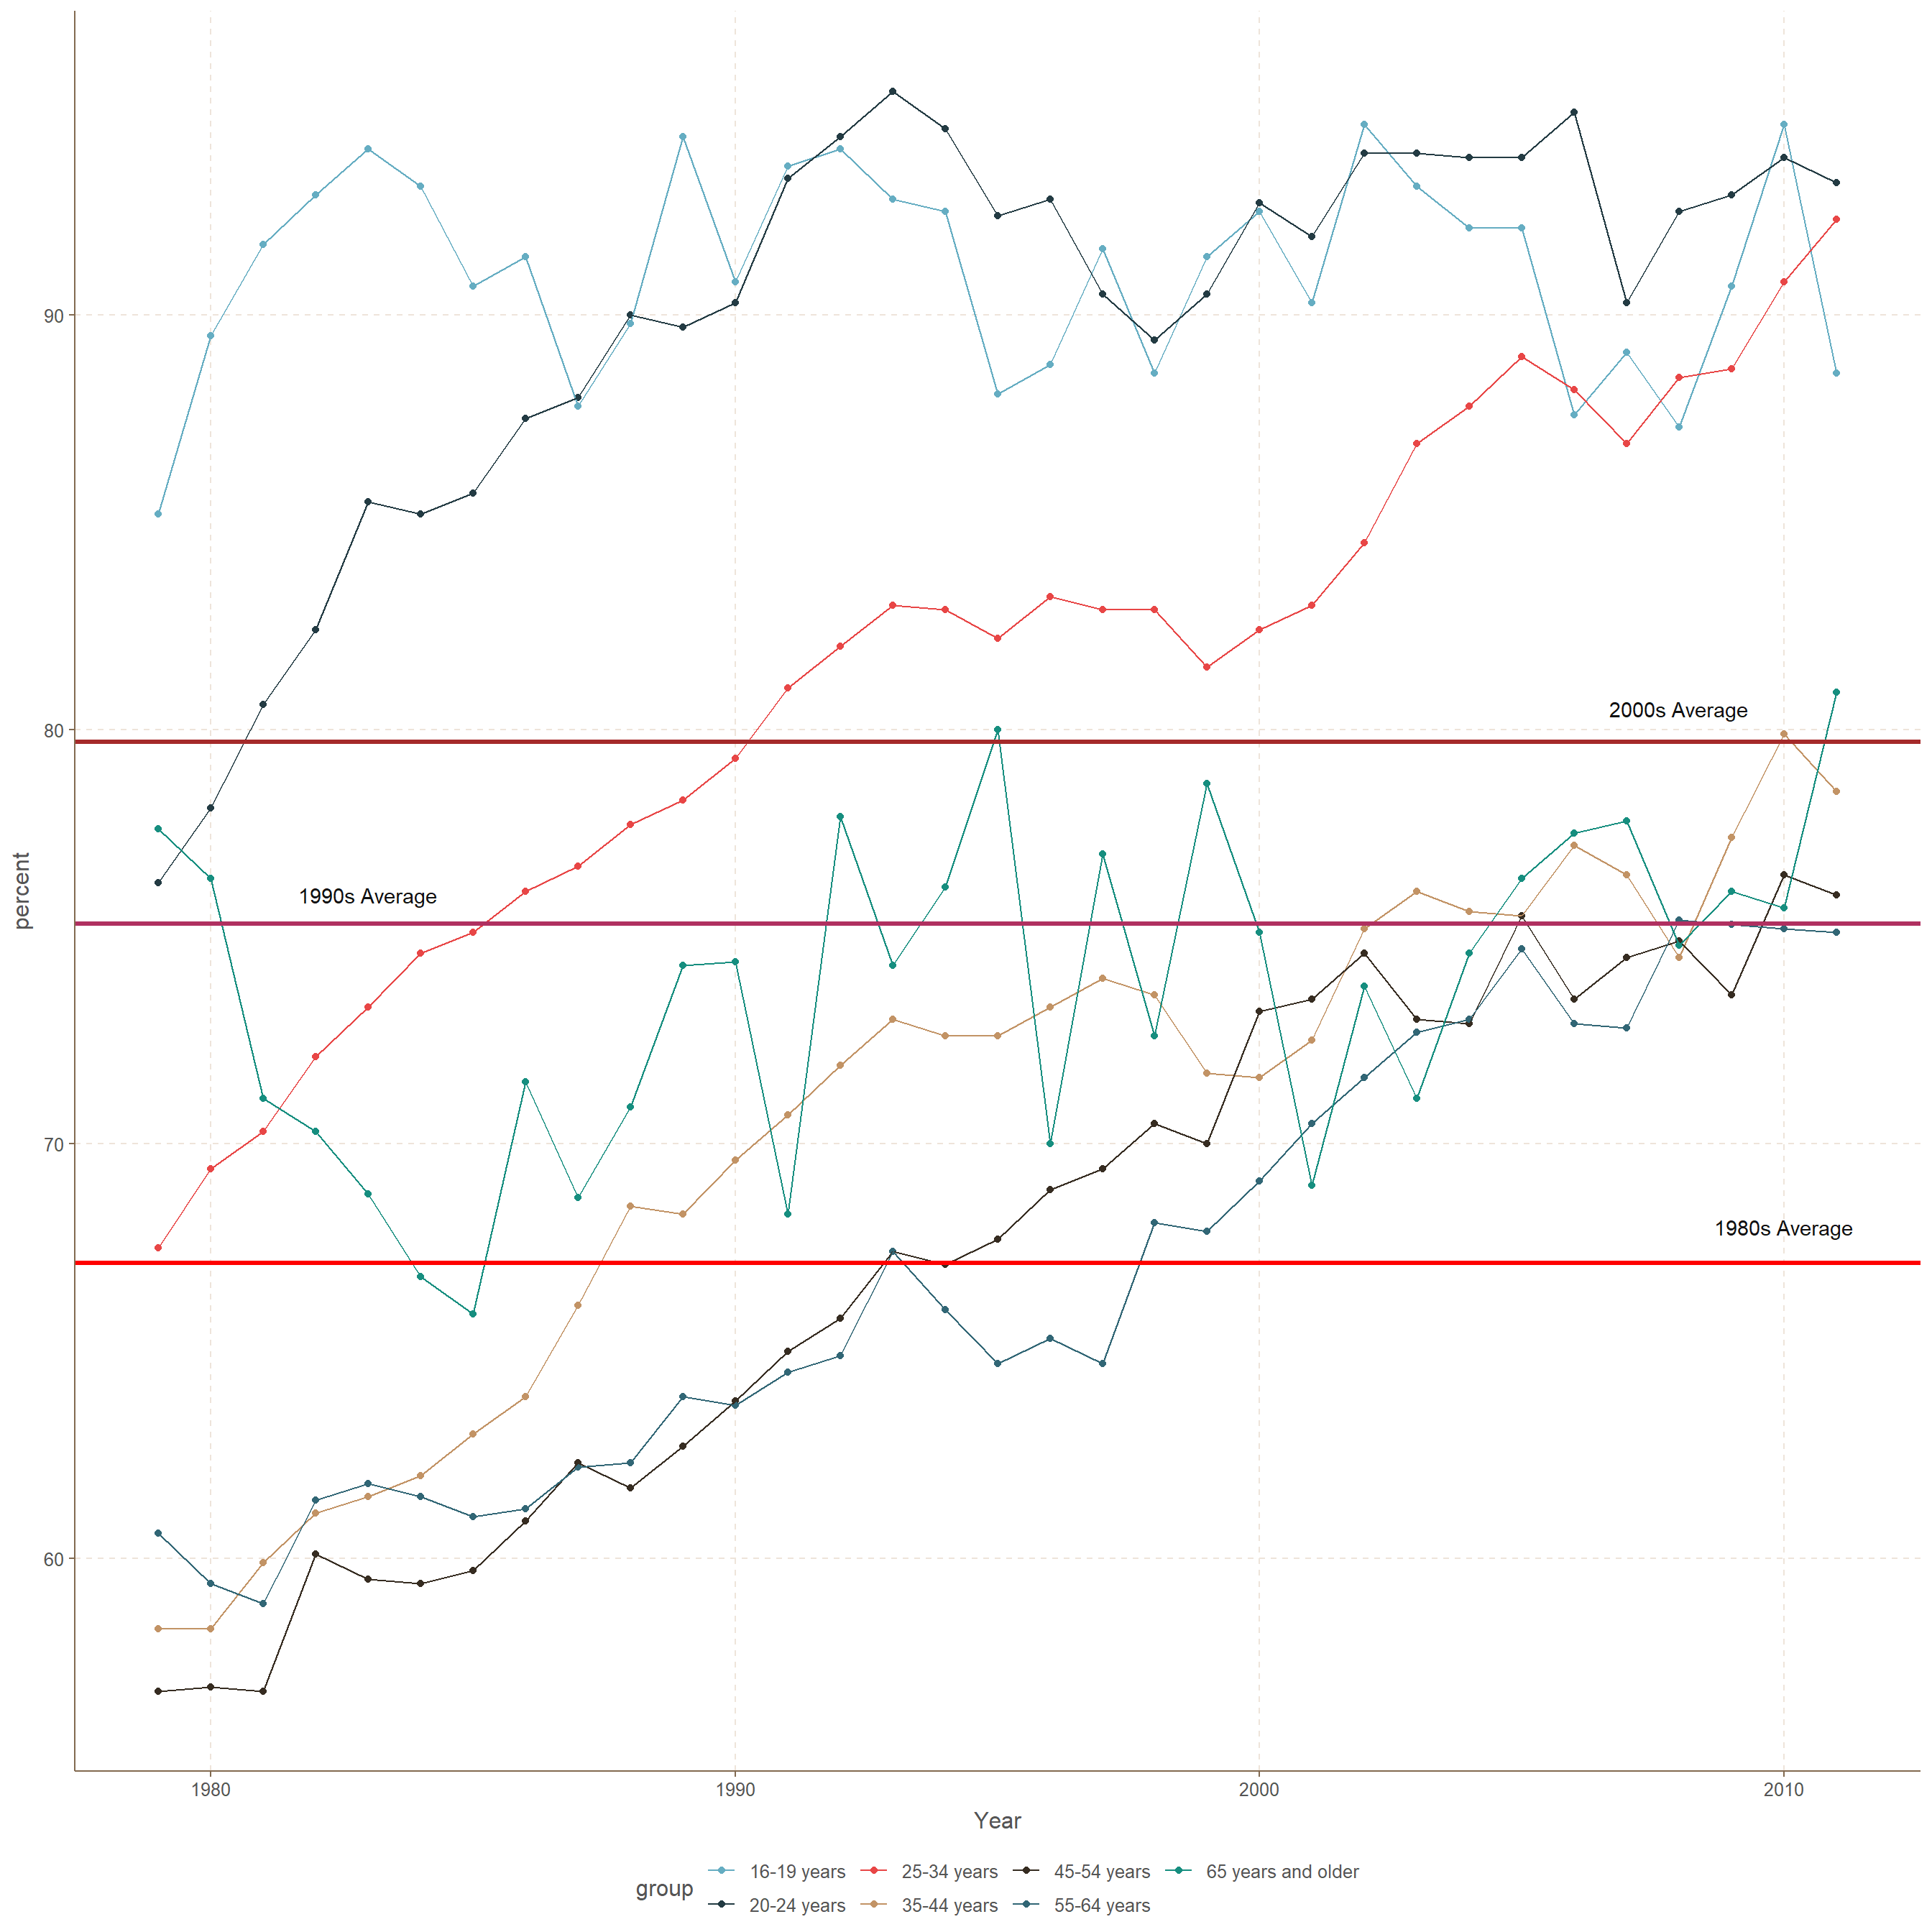
Employed Gender
Comparing Full Time with Part Time
employed_gender %>%
  select(year,total_full_time,total_part_time) %>%
  gather(Type,percent,c(total_full_time,total_part_time)) %>%
ggplot(.,aes(year,percent,fill=Type,label=round(percent)))+
  geom_col()+theme(legend.position = "bottom")+
  geom_text(nudge_y = -.75,color="white")+xlab("Year")+
  ylab("Percentage")+
  ggtitle("Total Work Force Full Time and Part Time")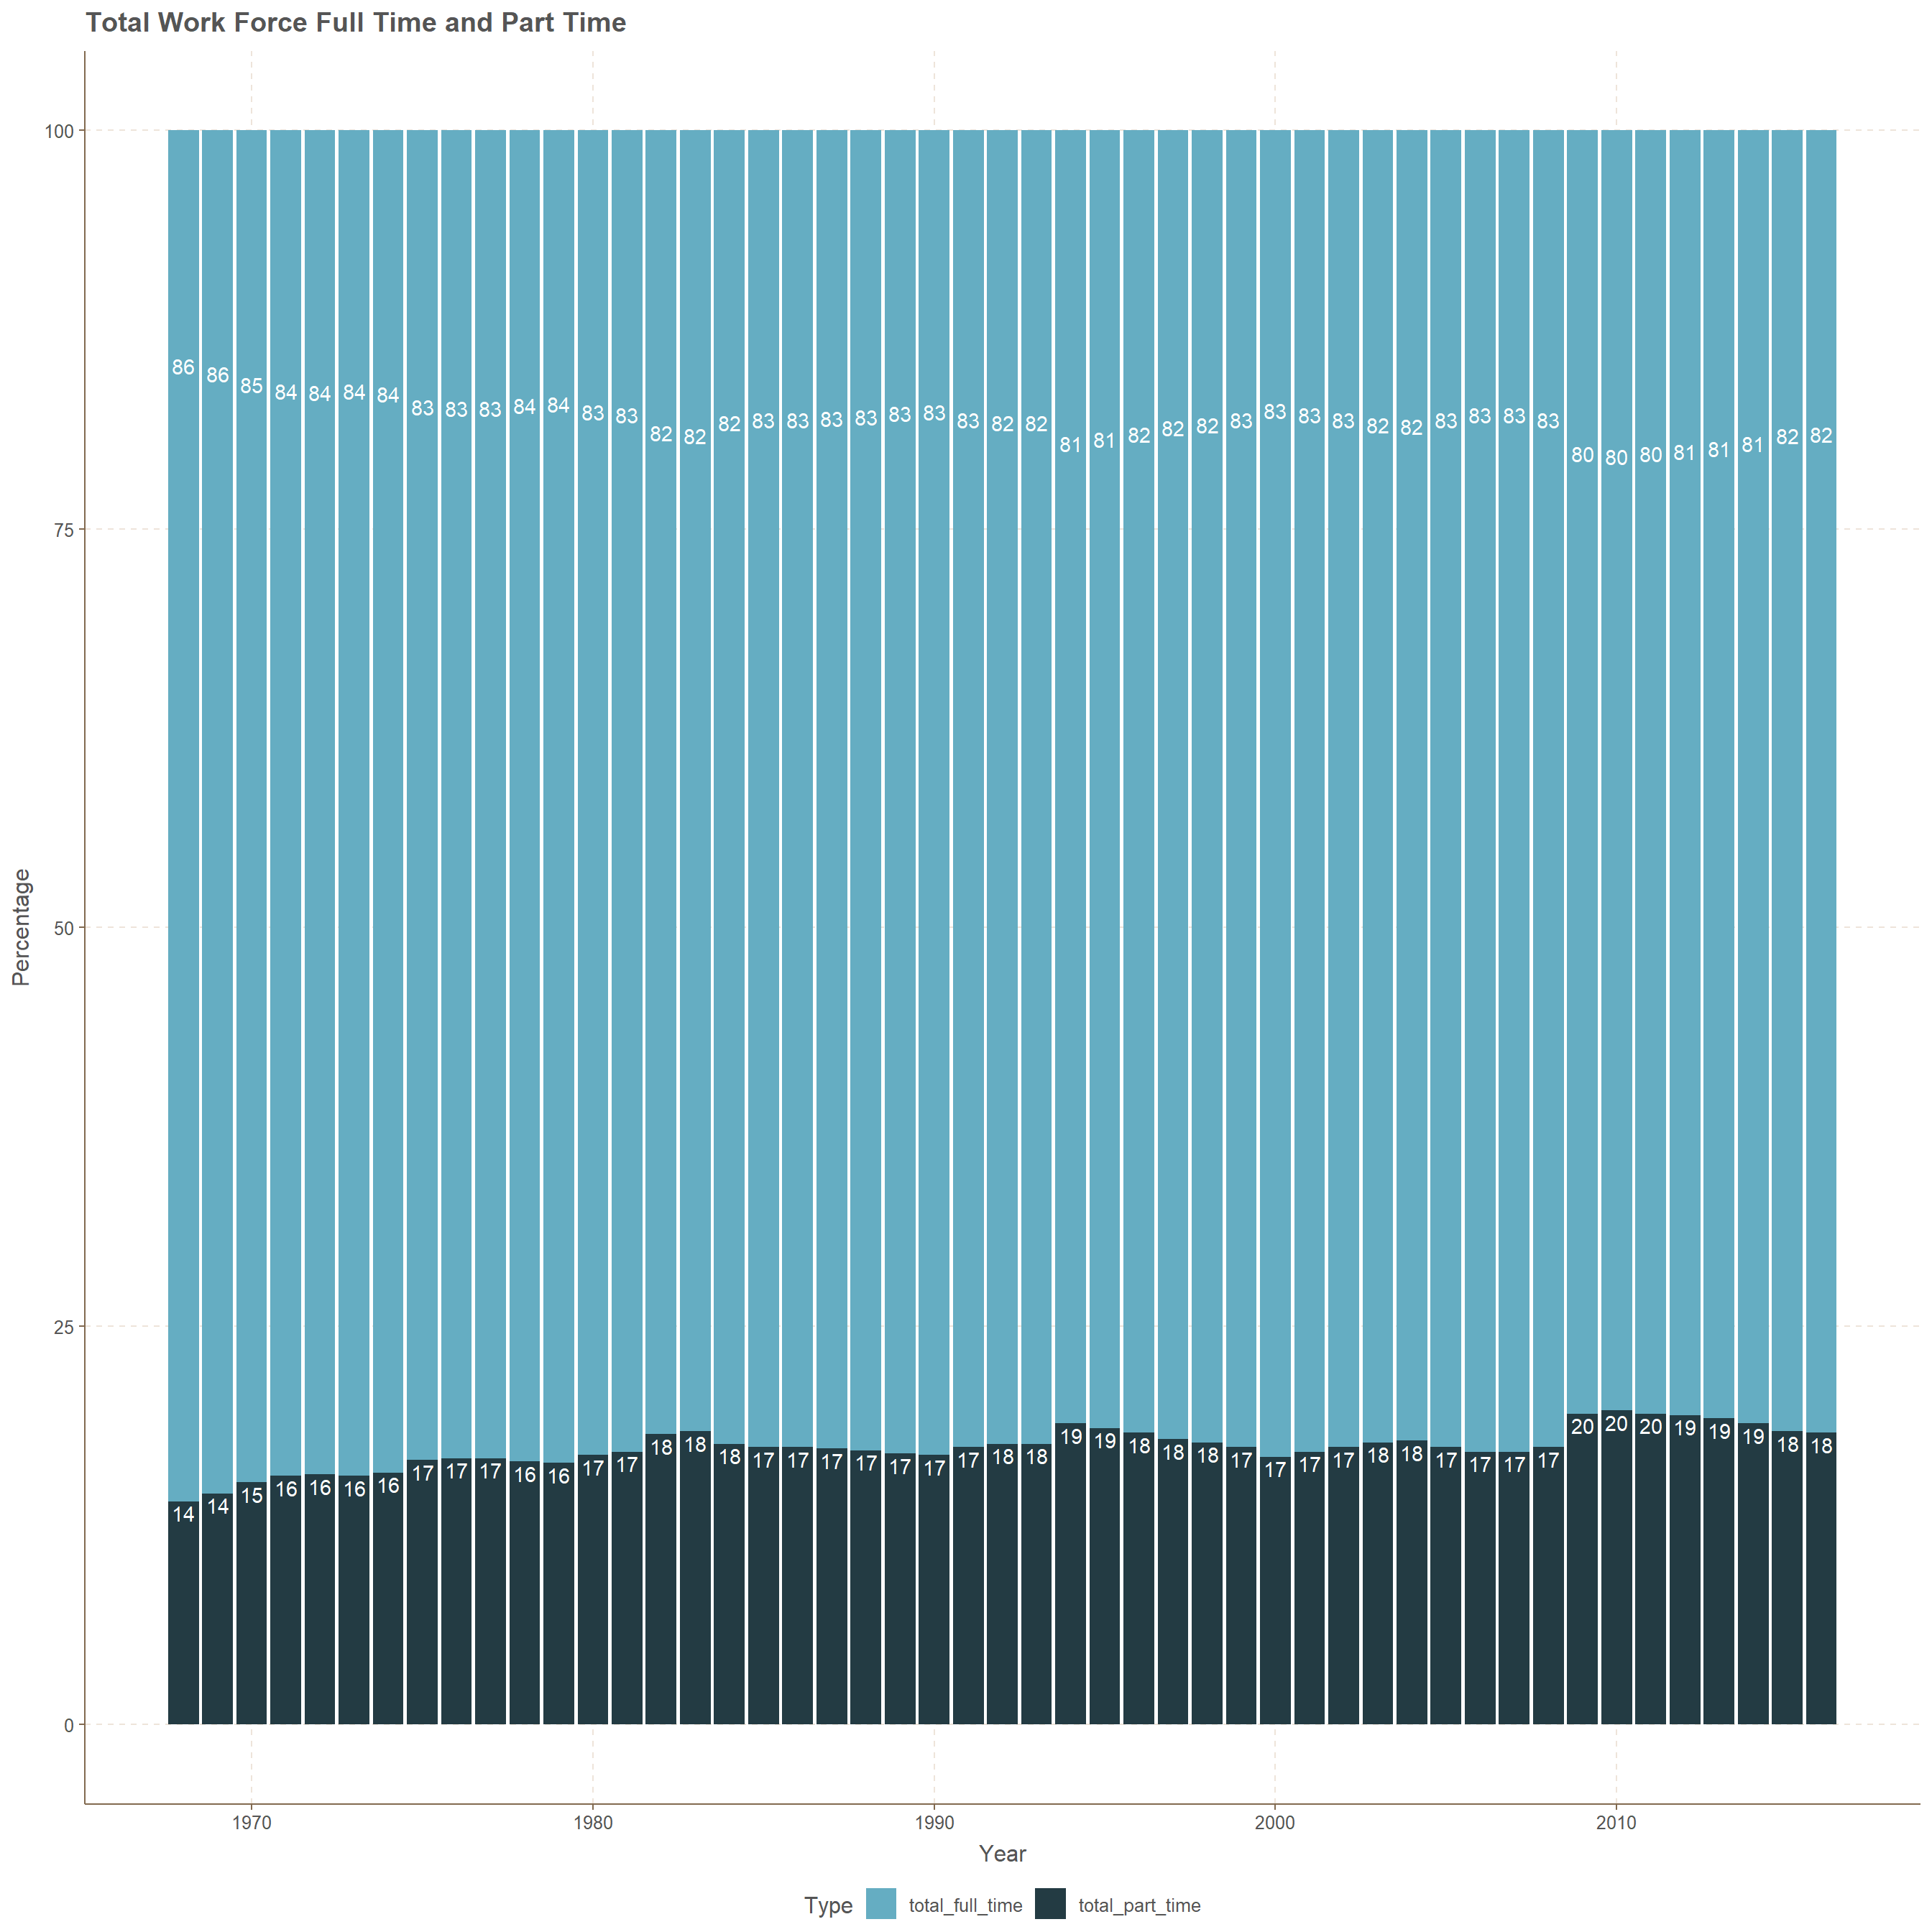
Male Occupants with Full Time and Part Time Work
employed_gender %>%
  select(year,full_time_male,part_time_male) %>%
  gather(Type,percent,c(full_time_male,part_time_male)) %>%
ggplot(.,aes(year,percent,fill=Type,label=round(percent)))+
  geom_col()+theme(legend.position = "bottom")+
  geom_text(nudge_y = -.75,color="white")+xlab("Year")+
  ylab("Percentage")+
  ggtitle("Male Work Force Full Time and Part Time")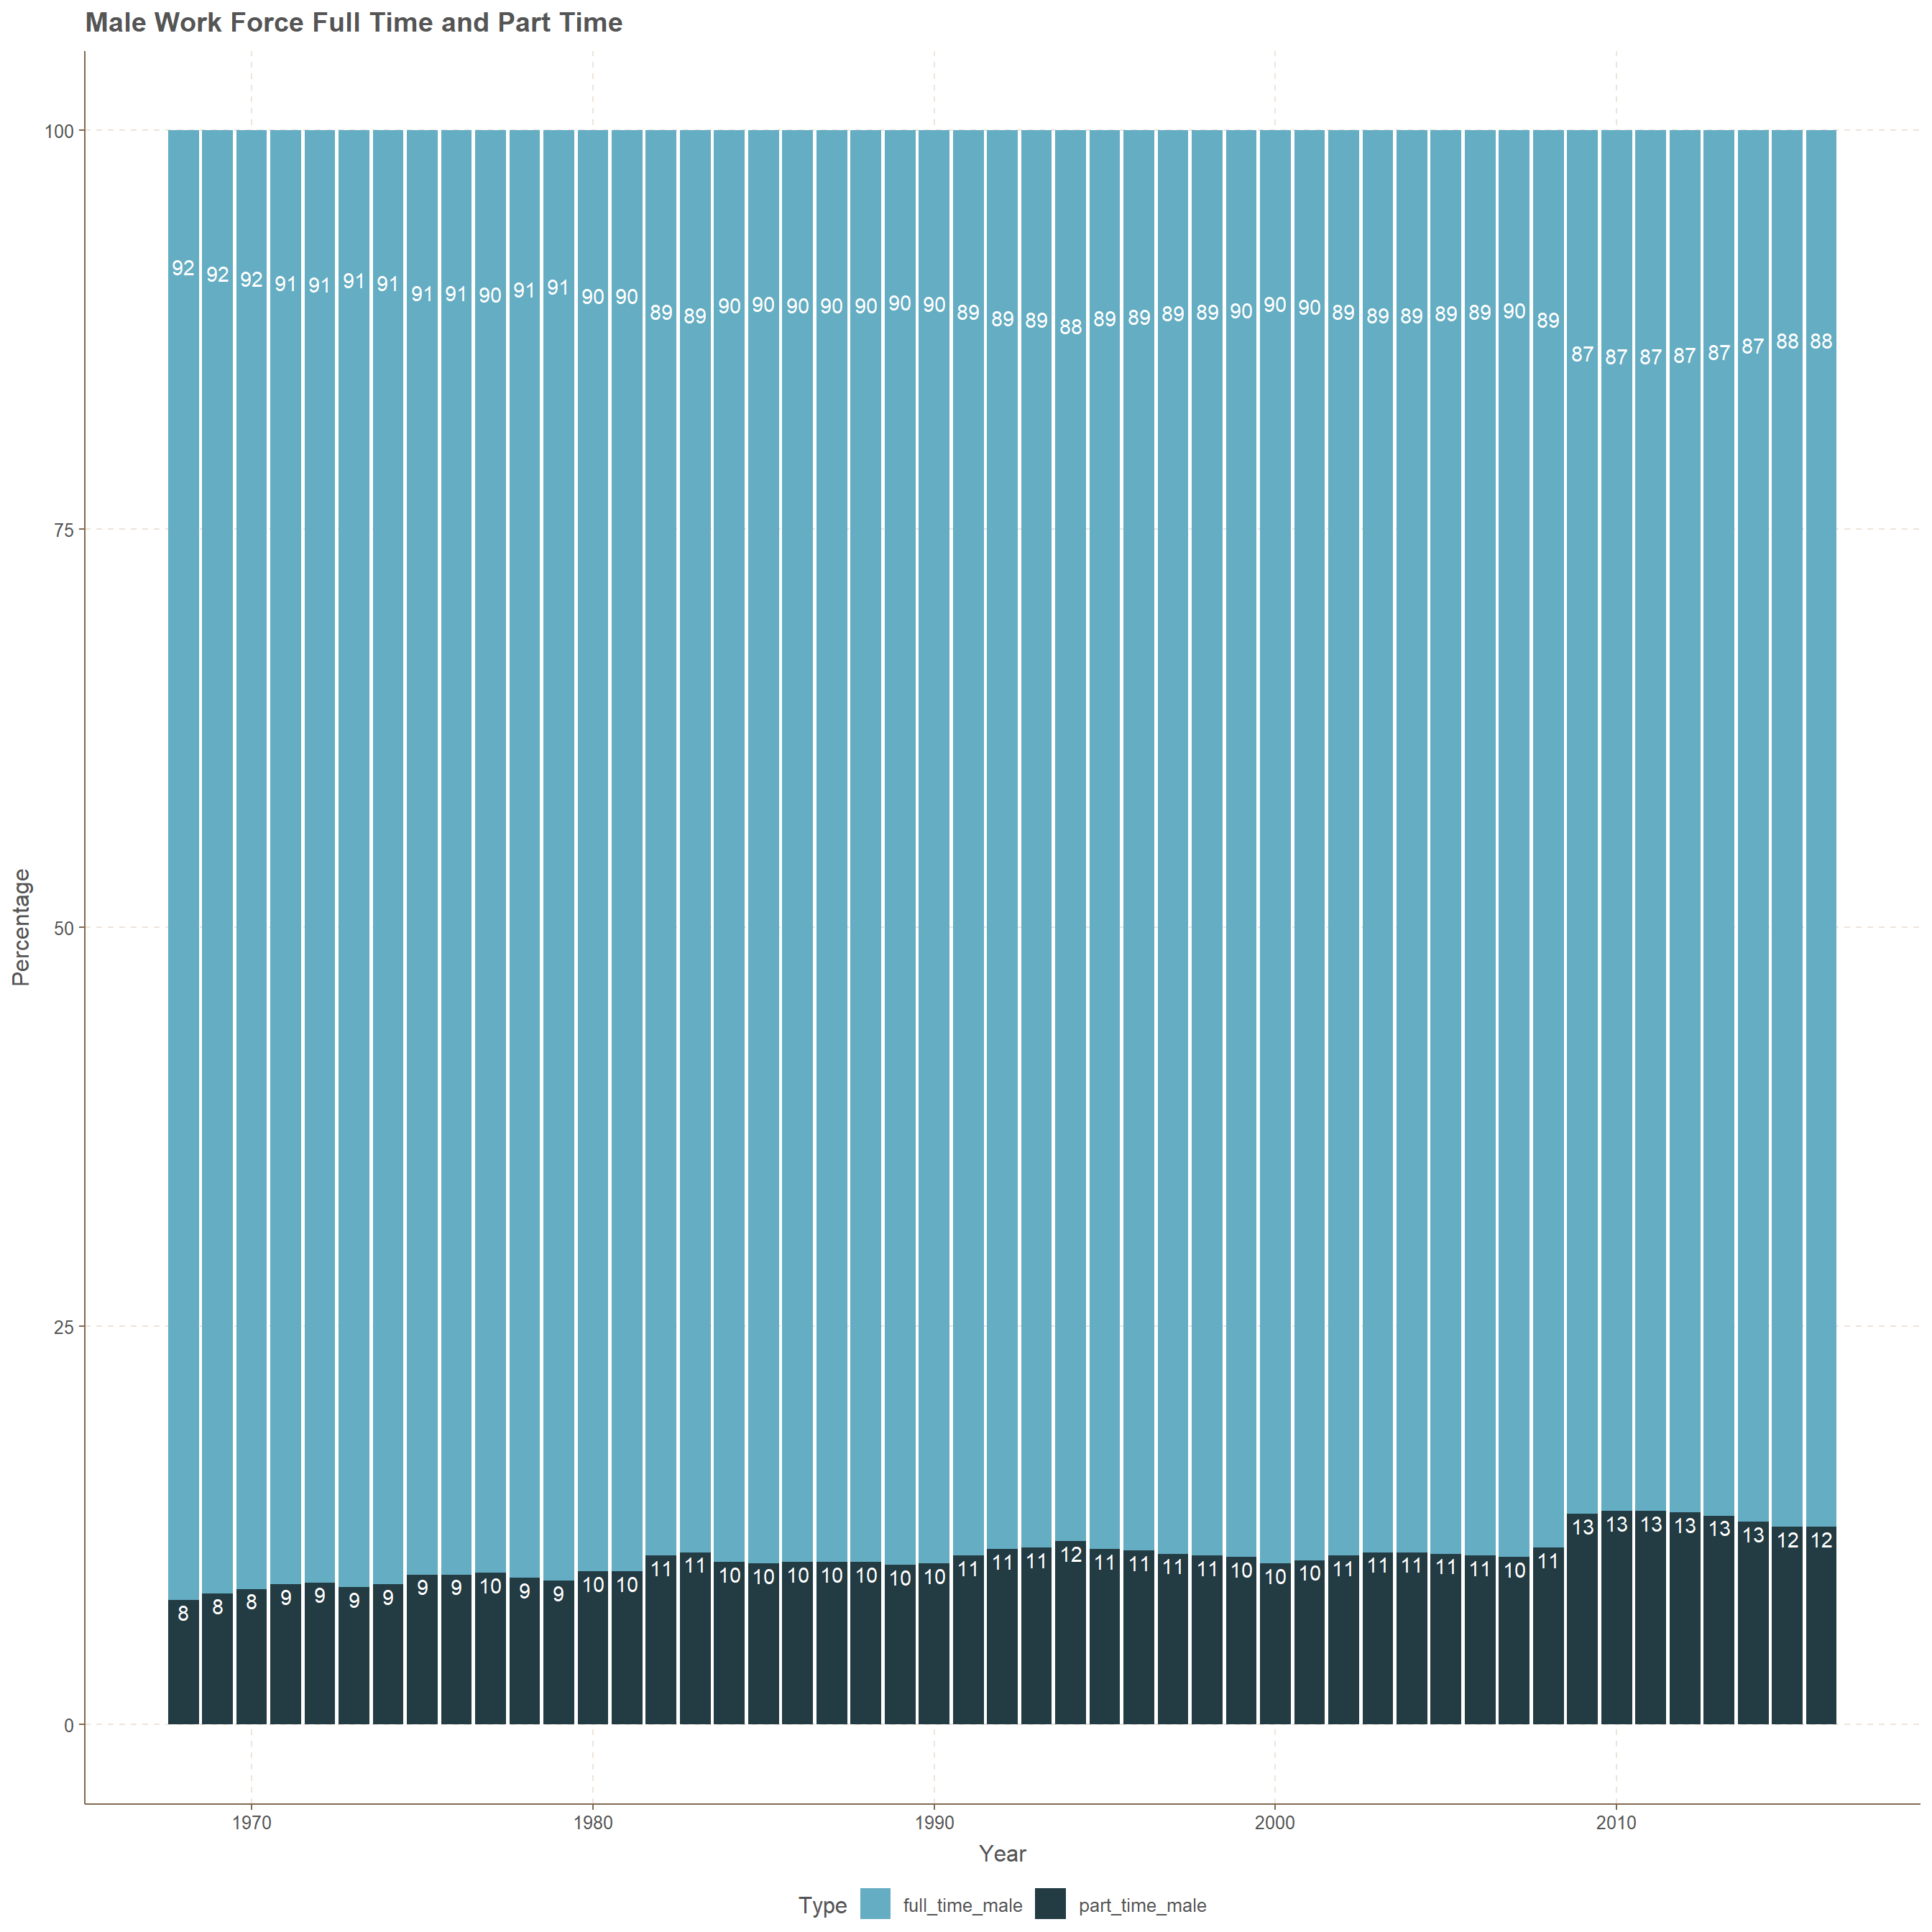
Female Occupants with Full Time and Part Time Work
employed_gender %>%
  select(year,full_time_female,part_time_female) %>%
  gather(Type,percent,c(full_time_female,part_time_female)) %>%
ggplot(.,aes(year,percent,fill=Type,label=round(percent)))+
  geom_col()+theme(legend.position = "bottom")+
  geom_text(nudge_y = -.75,color="white")+xlab("Year")+
  ylab("Percentage")+
  ggtitle("Female Work Force Full Time and Part Time")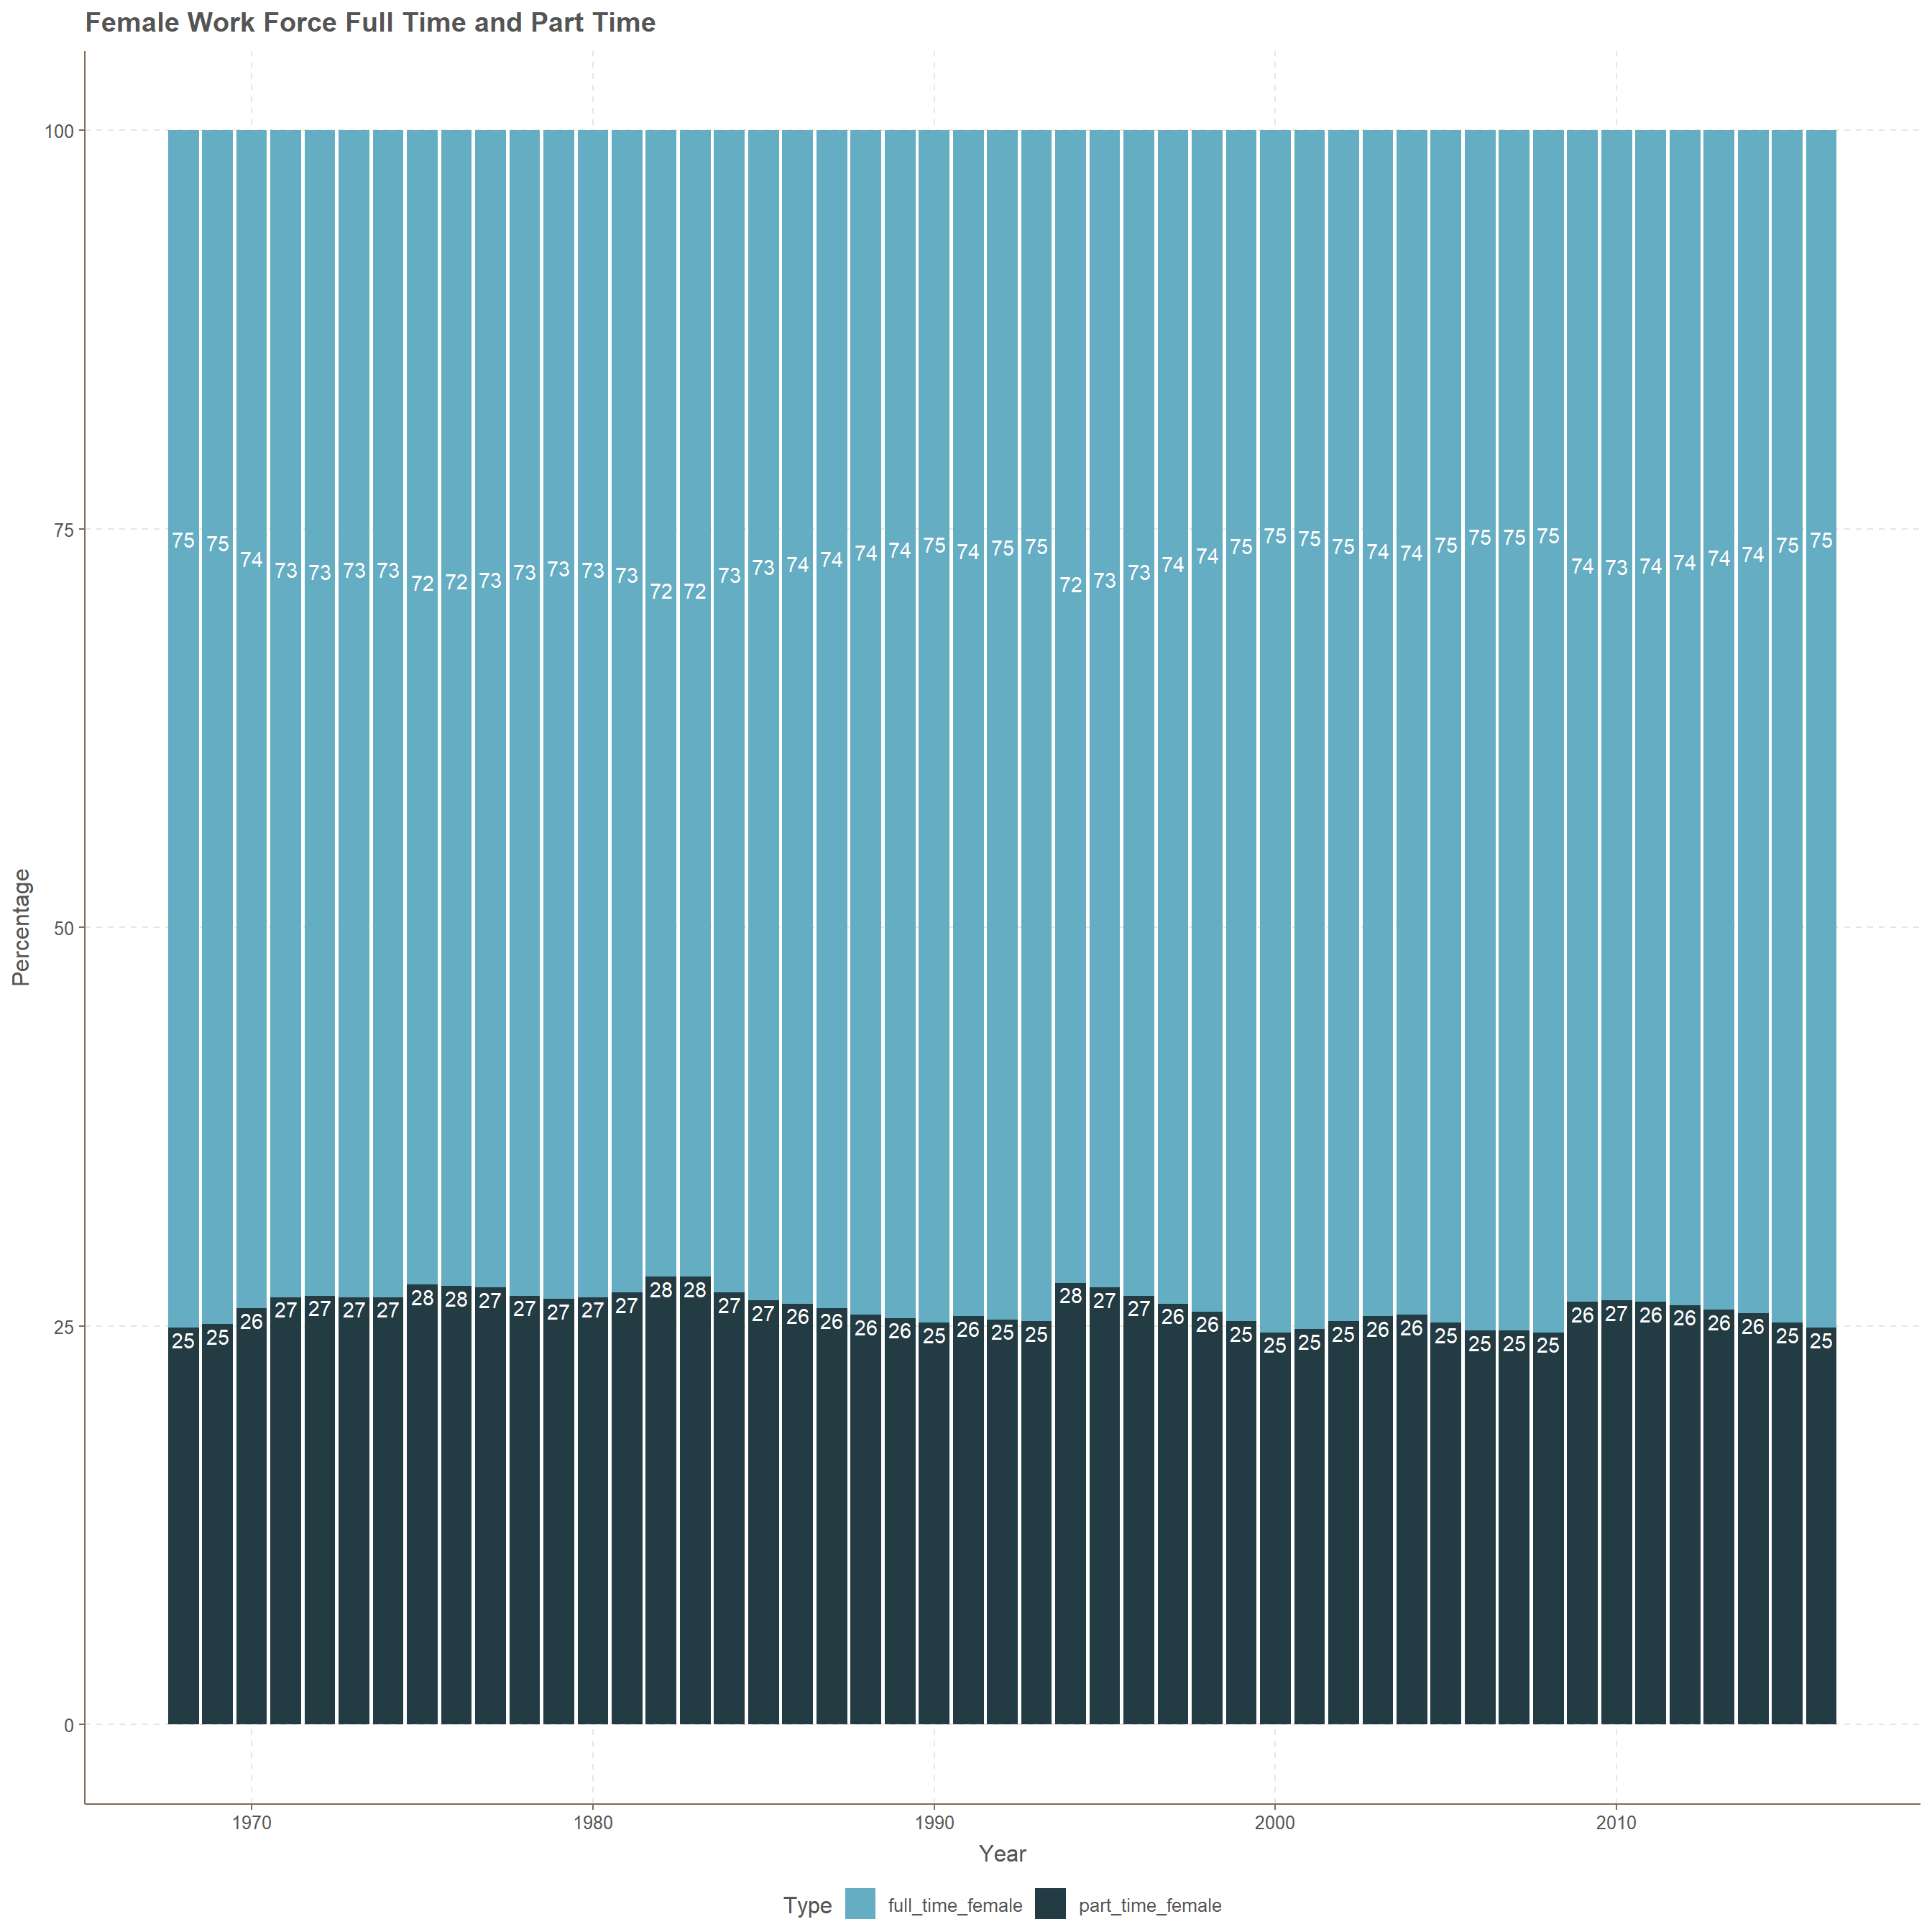
Jobs Gender
Major Category
Major Category and Total Workers
jg_avg<-jobs_gender %>%
        select(-one_of(c("occupation","minor_category"))) %>%
        group_by(year,major_category) %>%
        group_by(year) %>%
        summarize_if(is.numeric,funs(mean),na.rm=TRUE)

p<-jobs_gender %>%
     select(-one_of(c("occupation","minor_category"))) %>%
     group_by(year,major_category) %>%
     summarise_all(funs(mean),na.rm=TRUE) %>%
ggplot(.,aes(str_wrap(major_category,12),total_workers,label=round(total_workers,2)))+
  geom_col()+transition_time(year)+ease_aes("linear")+
  ggtitle("Total Workers changing Over time",subtitle = "Year :{frame_time}")+
  xlab("Major Category")+ylab("Total Workers")+geom_text(vjust=-1)

animate(p,nframes=4,fps=1)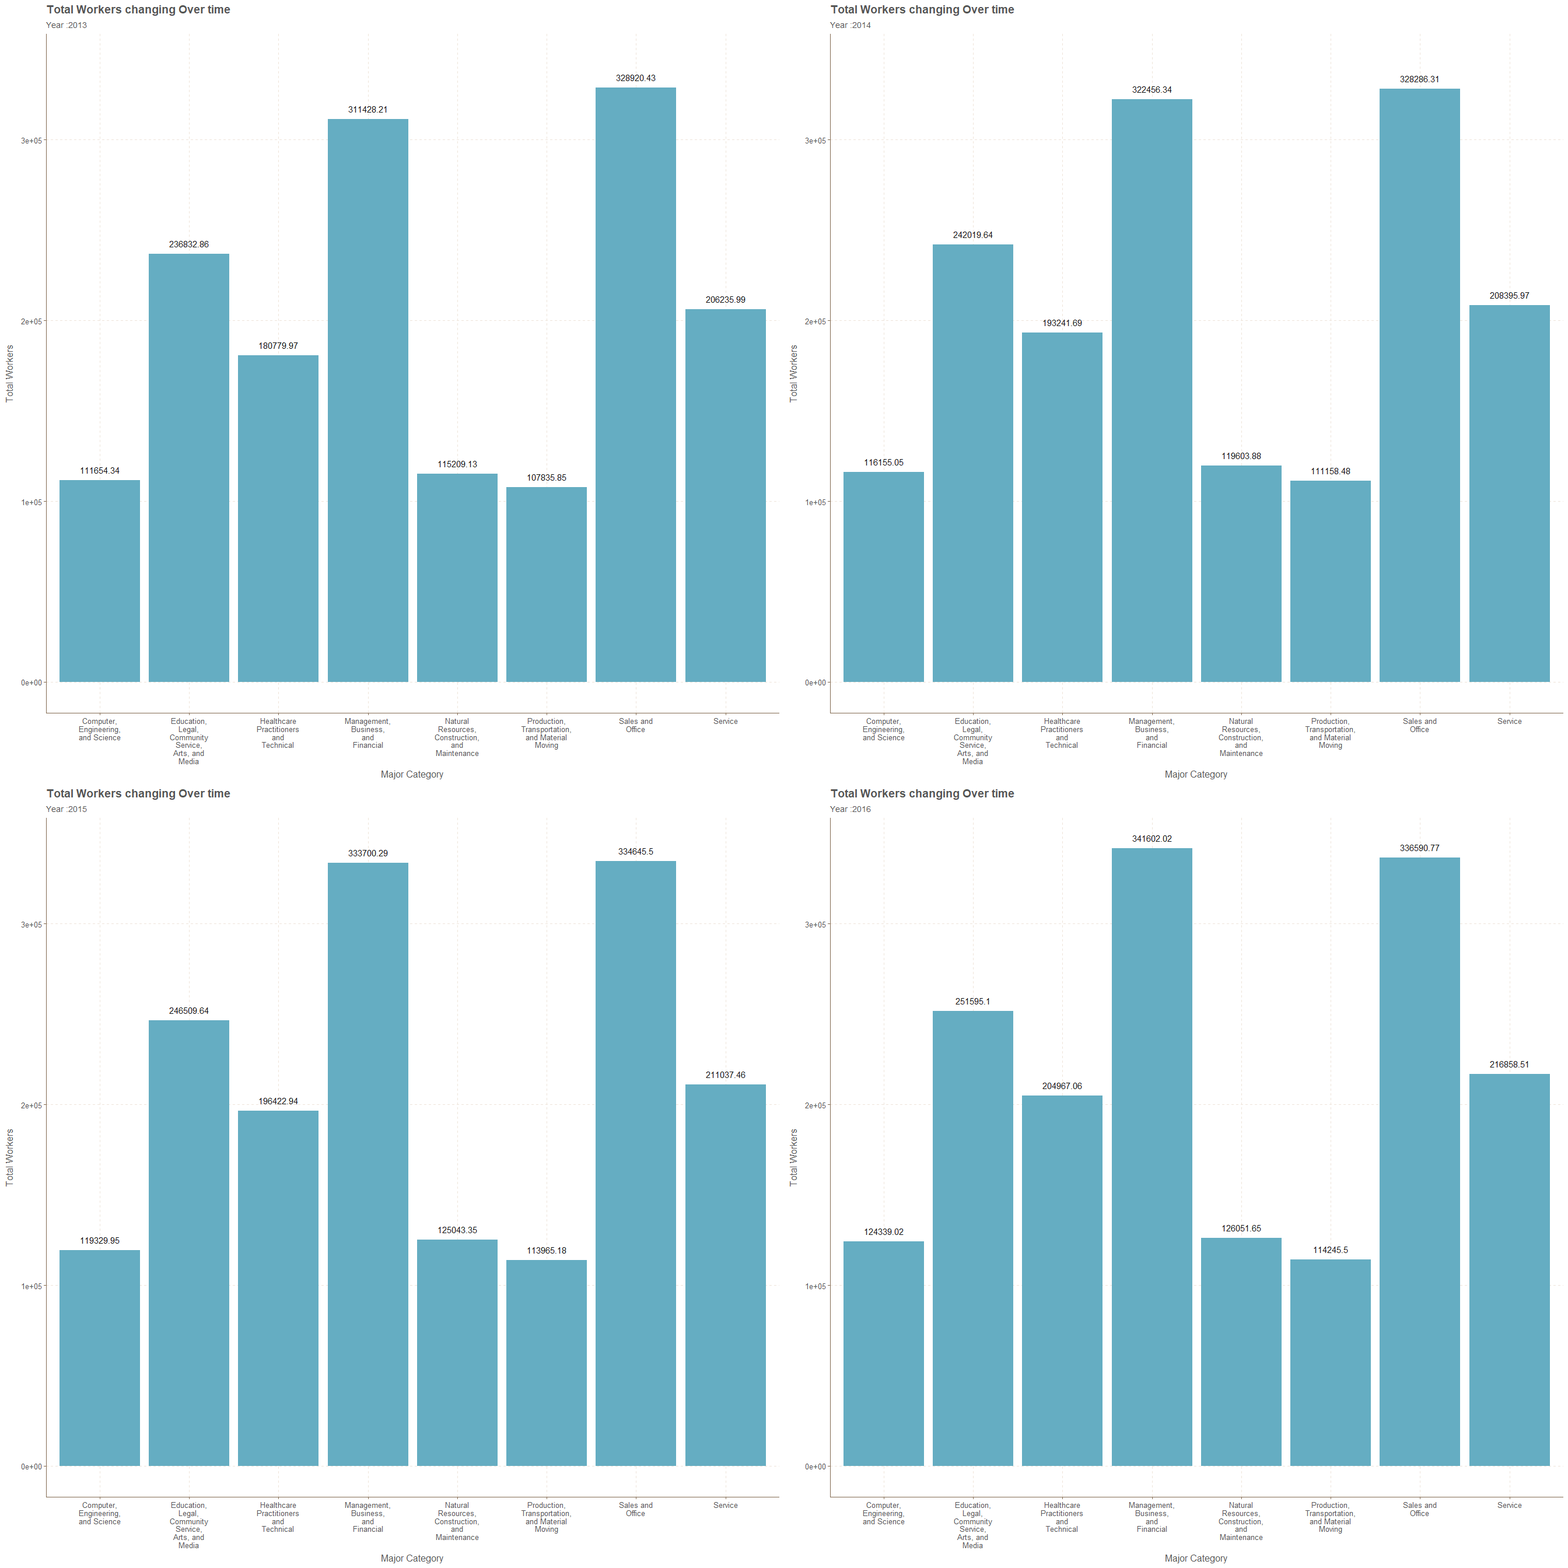
Major Category and Male Workers
p<-jobs_gender %>%
     select(-one_of(c("occupation","minor_category"))) %>%
     group_by(year,major_category) %>%
     summarise_all(funs(mean),na.rm=TRUE) %>%
ggplot(.,aes(str_wrap(major_category,12),workers_male,label=round(workers_male,2)))+
  geom_col()+transition_time(year)+ease_aes("linear")+
  ggtitle("Male Workers changing Over time",subtitle = "Year :{frame_time}")+
  xlab("Major Category")+ylab("Male Workers")+geom_text(vjust=-1)

animate(p,nframes=4,fps=1)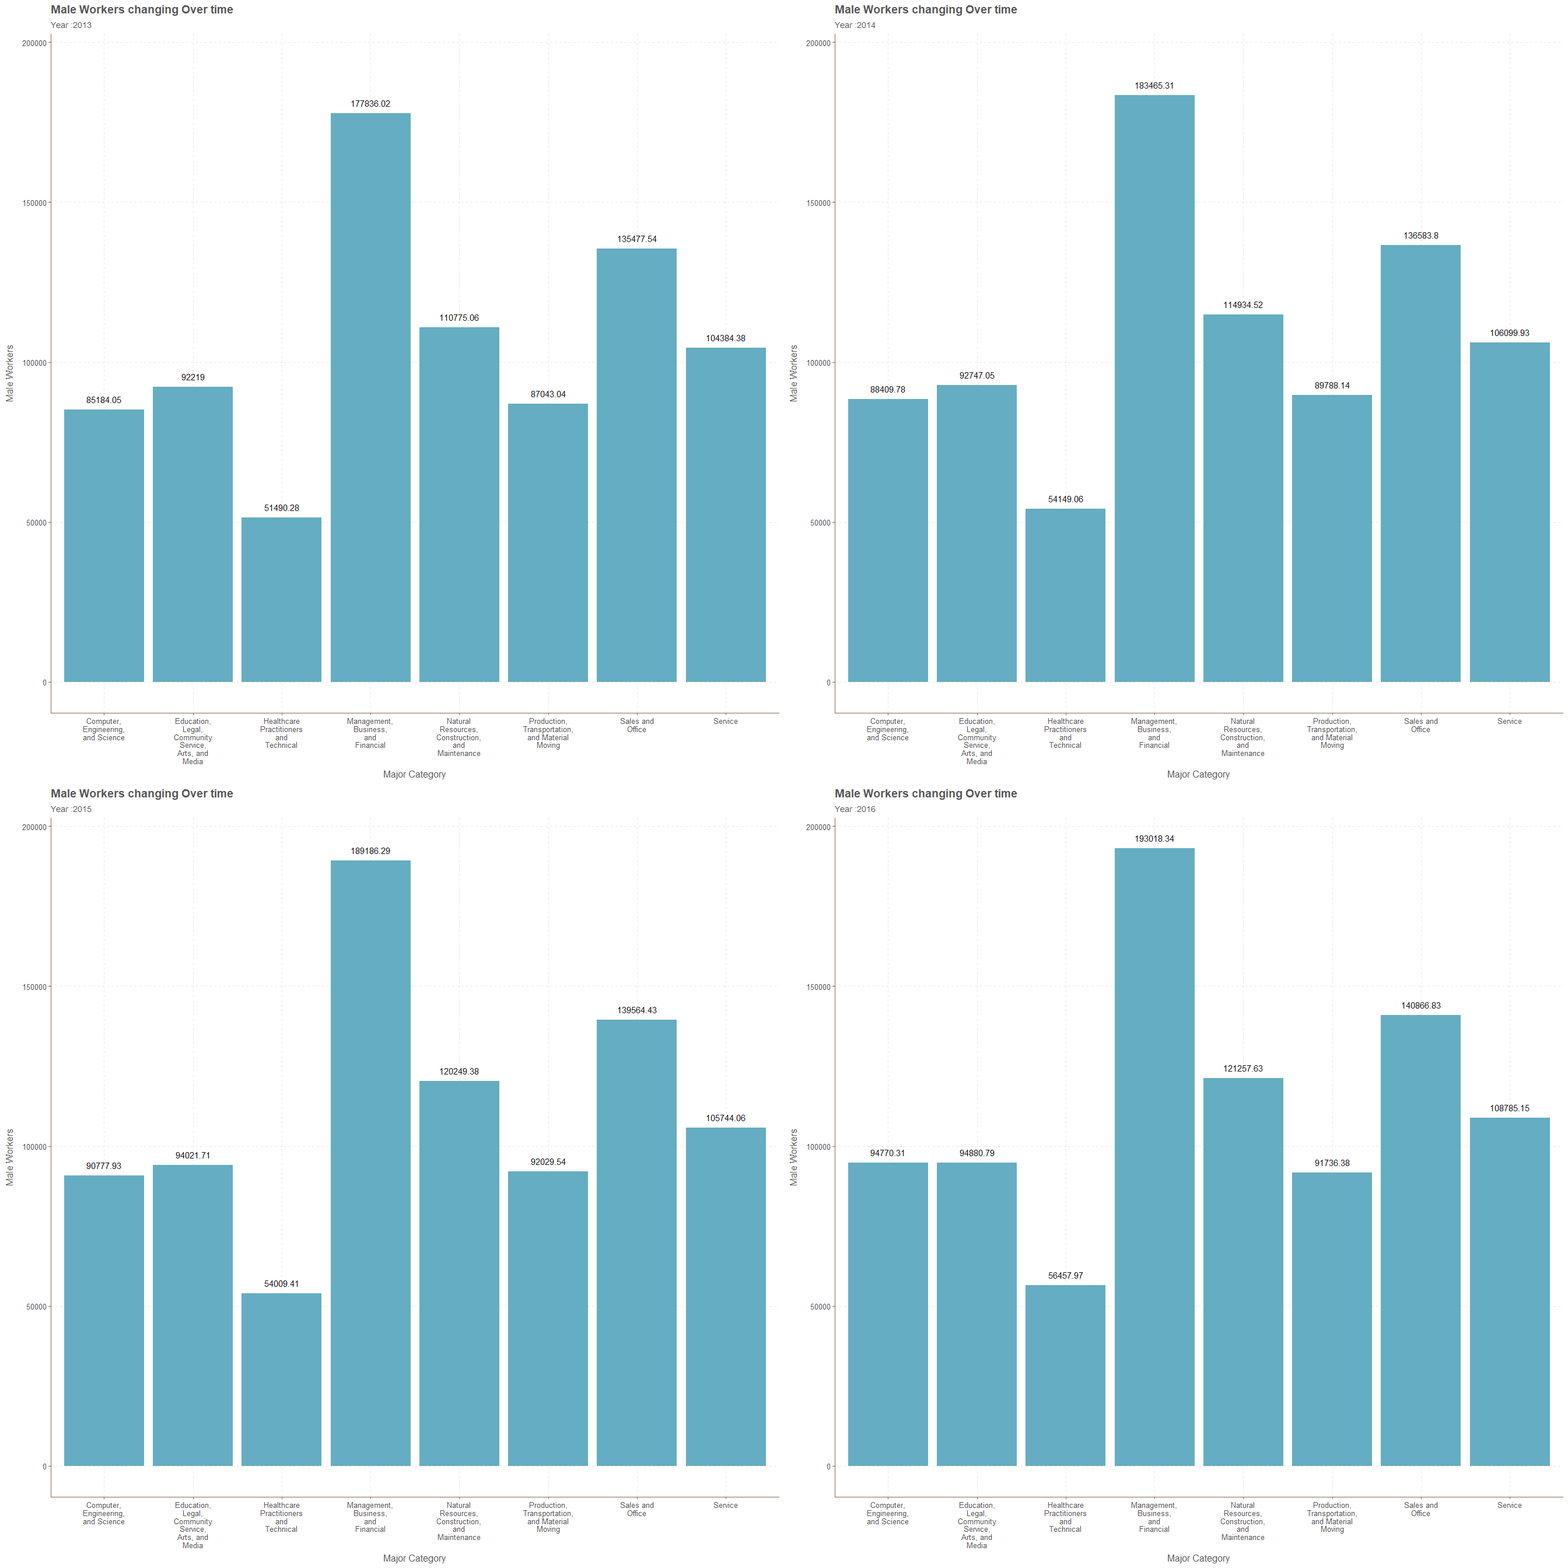
Major Category and Female Workers
p<-jobs_gender %>%
     select(-one_of(c("occupation","minor_category"))) %>%
     group_by(year,major_category) %>%
     summarise_all(funs(mean),na.rm=TRUE) %>%
ggplot(.,aes(str_wrap(major_category,12),workers_female,label=round(workers_female,2)))+
  geom_col()+transition_time(year)+ease_aes("linear")+
  ggtitle("Female Workers changing Over time",subtitle = "Year :{frame_time}")+
  xlab("Major Category")+ylab("Female Workers")+geom_text(vjust=-1)

animate(p,nframes=4,fps=1)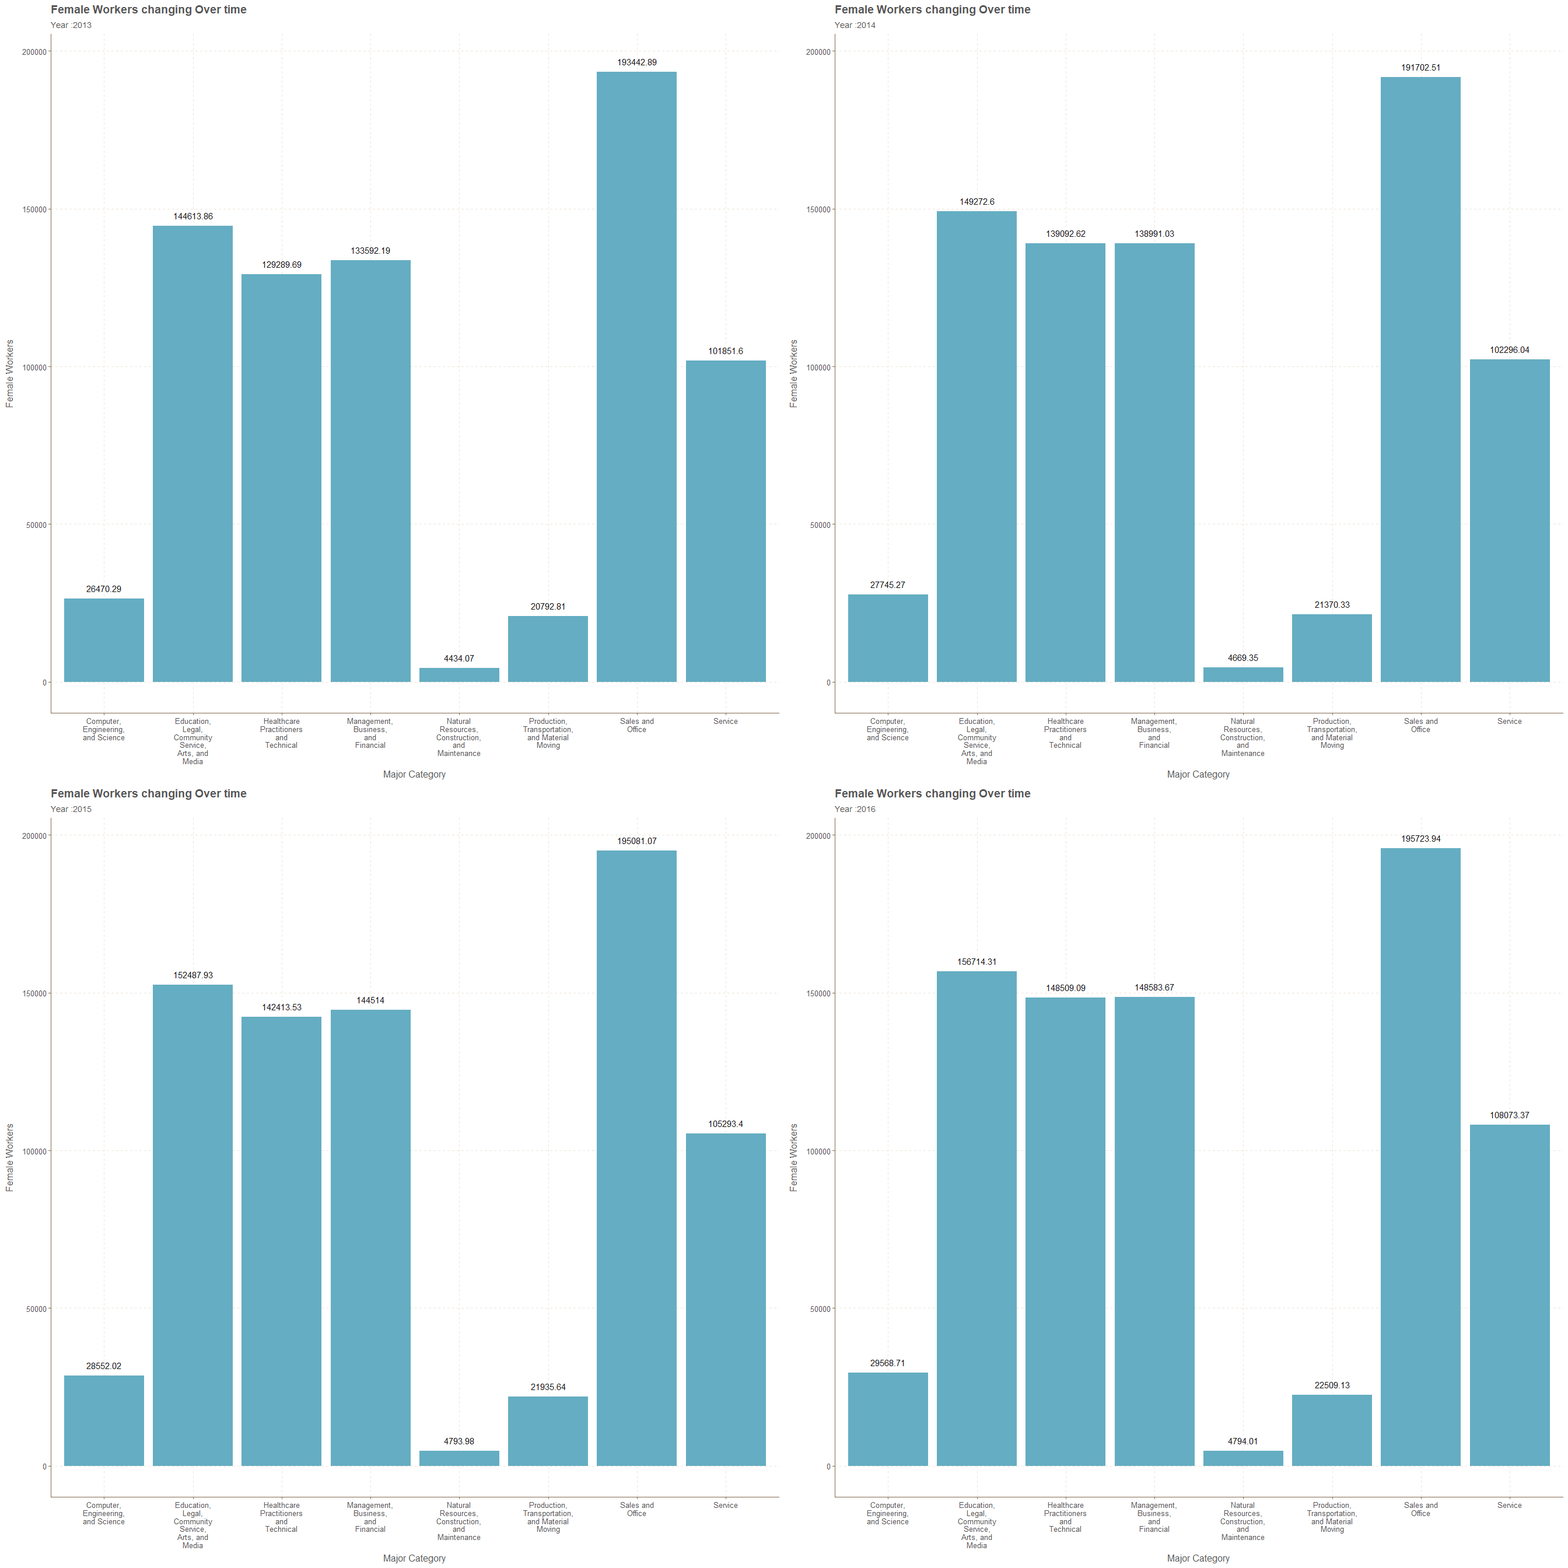
Major Category and Total Earnings Male Wage
p<-jobs_gender %>%
     select(-one_of(c("occupation","minor_category"))) %>%
     group_by(year,major_category) %>%
     summarise_all(funs(mean),na.rm=TRUE) %>%
ggplot(.,aes(str_wrap(major_category,12),total_earnings_male,label=round(total_earnings_male,2)))+
  geom_col()+transition_time(year)+ease_aes("linear") +
  ggtitle("Total Earnings Male Wage changing Over time",subtitle = "Year :{frame_time}")+
  xlab("Major Category")+ylab("Total Earnings Male")+geom_text(vjust=-1)

animate(p,nframes=4,fps=1)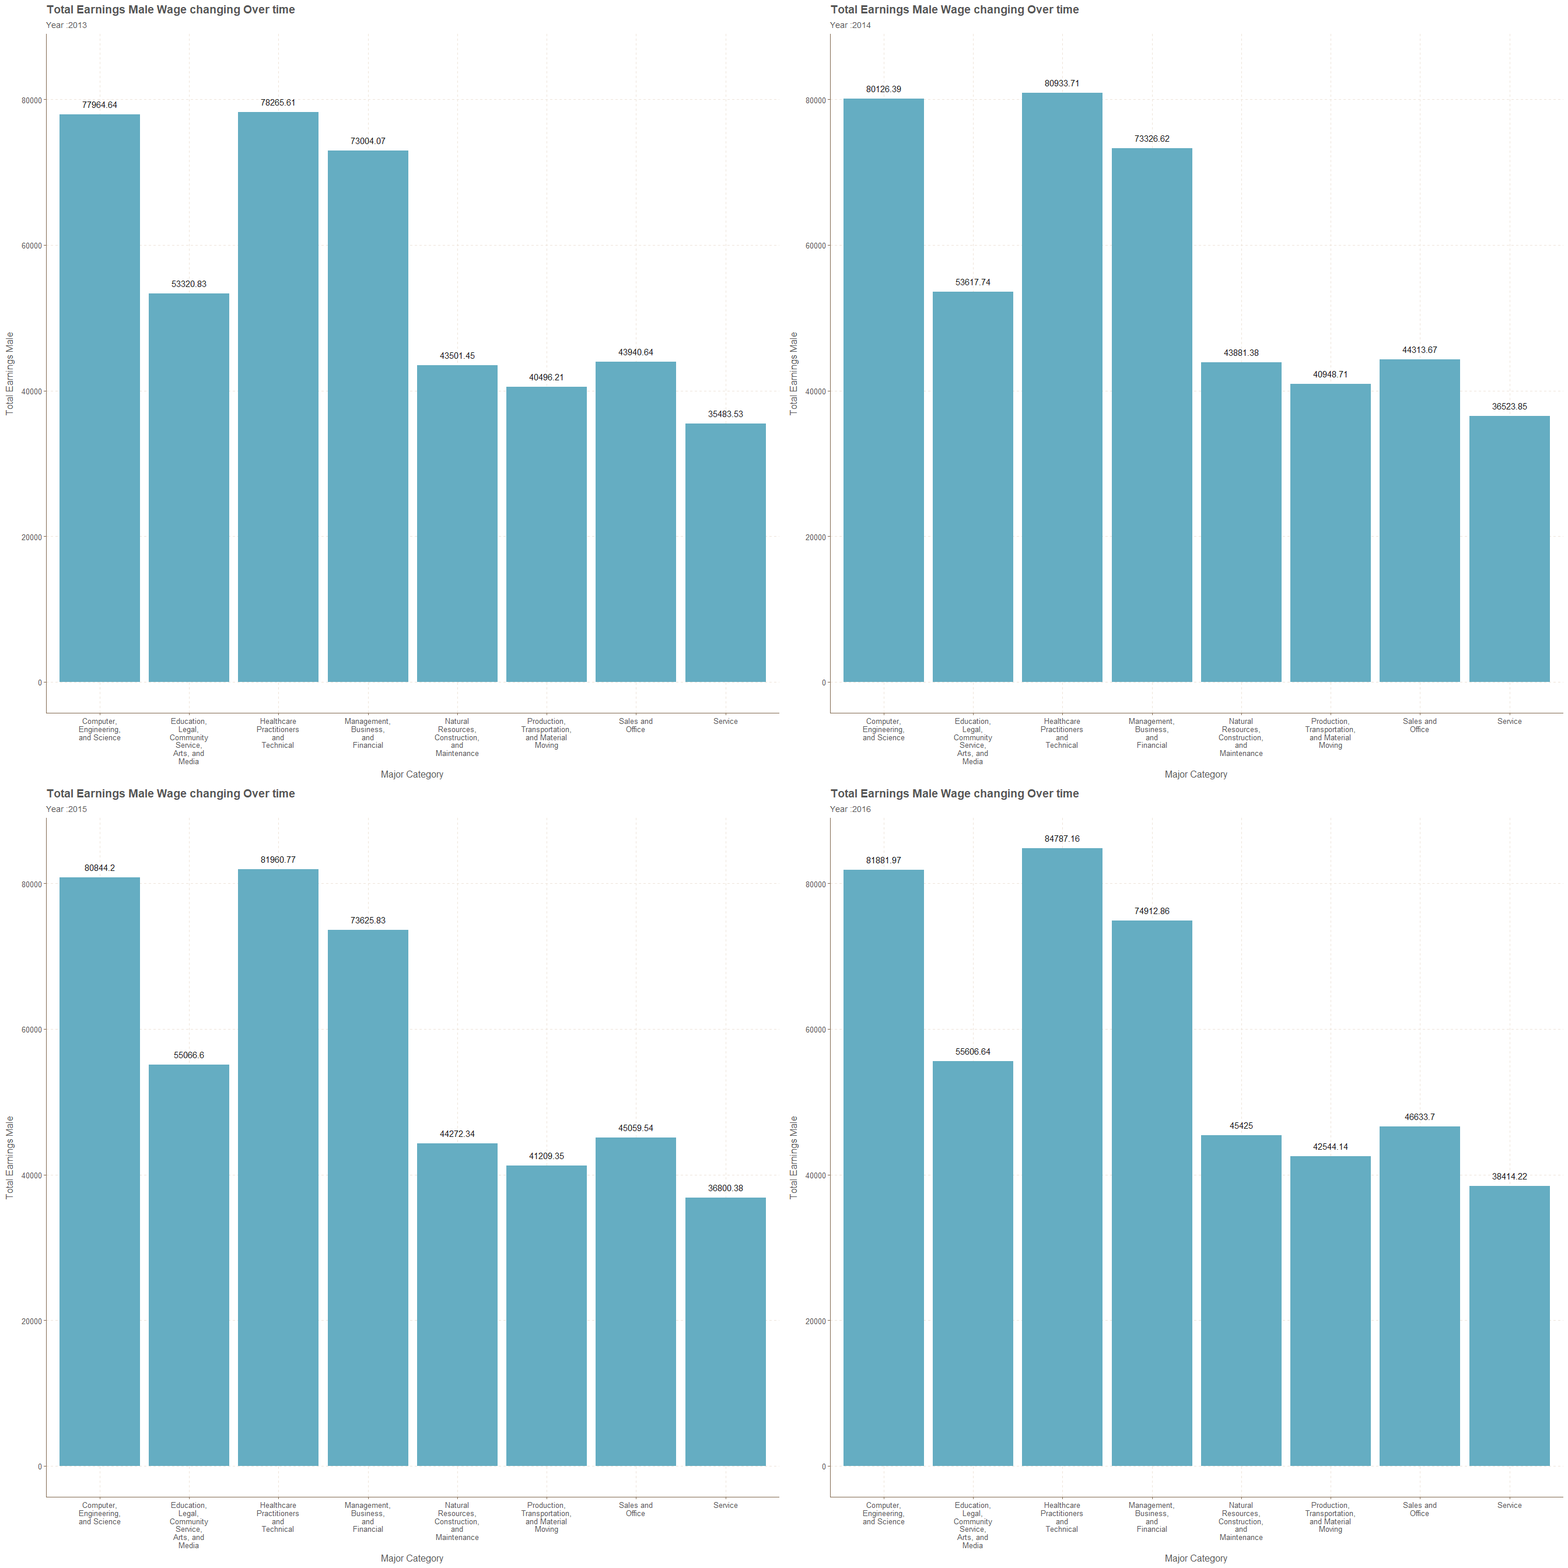
Major Category and Total Earnings Female Wage
p<-jobs_gender %>%
     select(-one_of(c("occupation","minor_category"))) %>%
     group_by(year,major_category) %>%
     summarise_all(funs(mean),na.rm=TRUE) %>%
ggplot(.,aes(str_wrap(major_category,12),total_earnings_female,label=round(total_earnings_female)))+
  geom_col()+transition_time(year)+ease_aes("linear")+
  ggtitle("Total Earnings Female Wage changing Over time",subtitle = "Year :{frame_time}")+
  xlab("Major Category")+ylab("Total Earnings Female")+geom_text(vjust=-1)

animate(p,nframes=4,fps=1)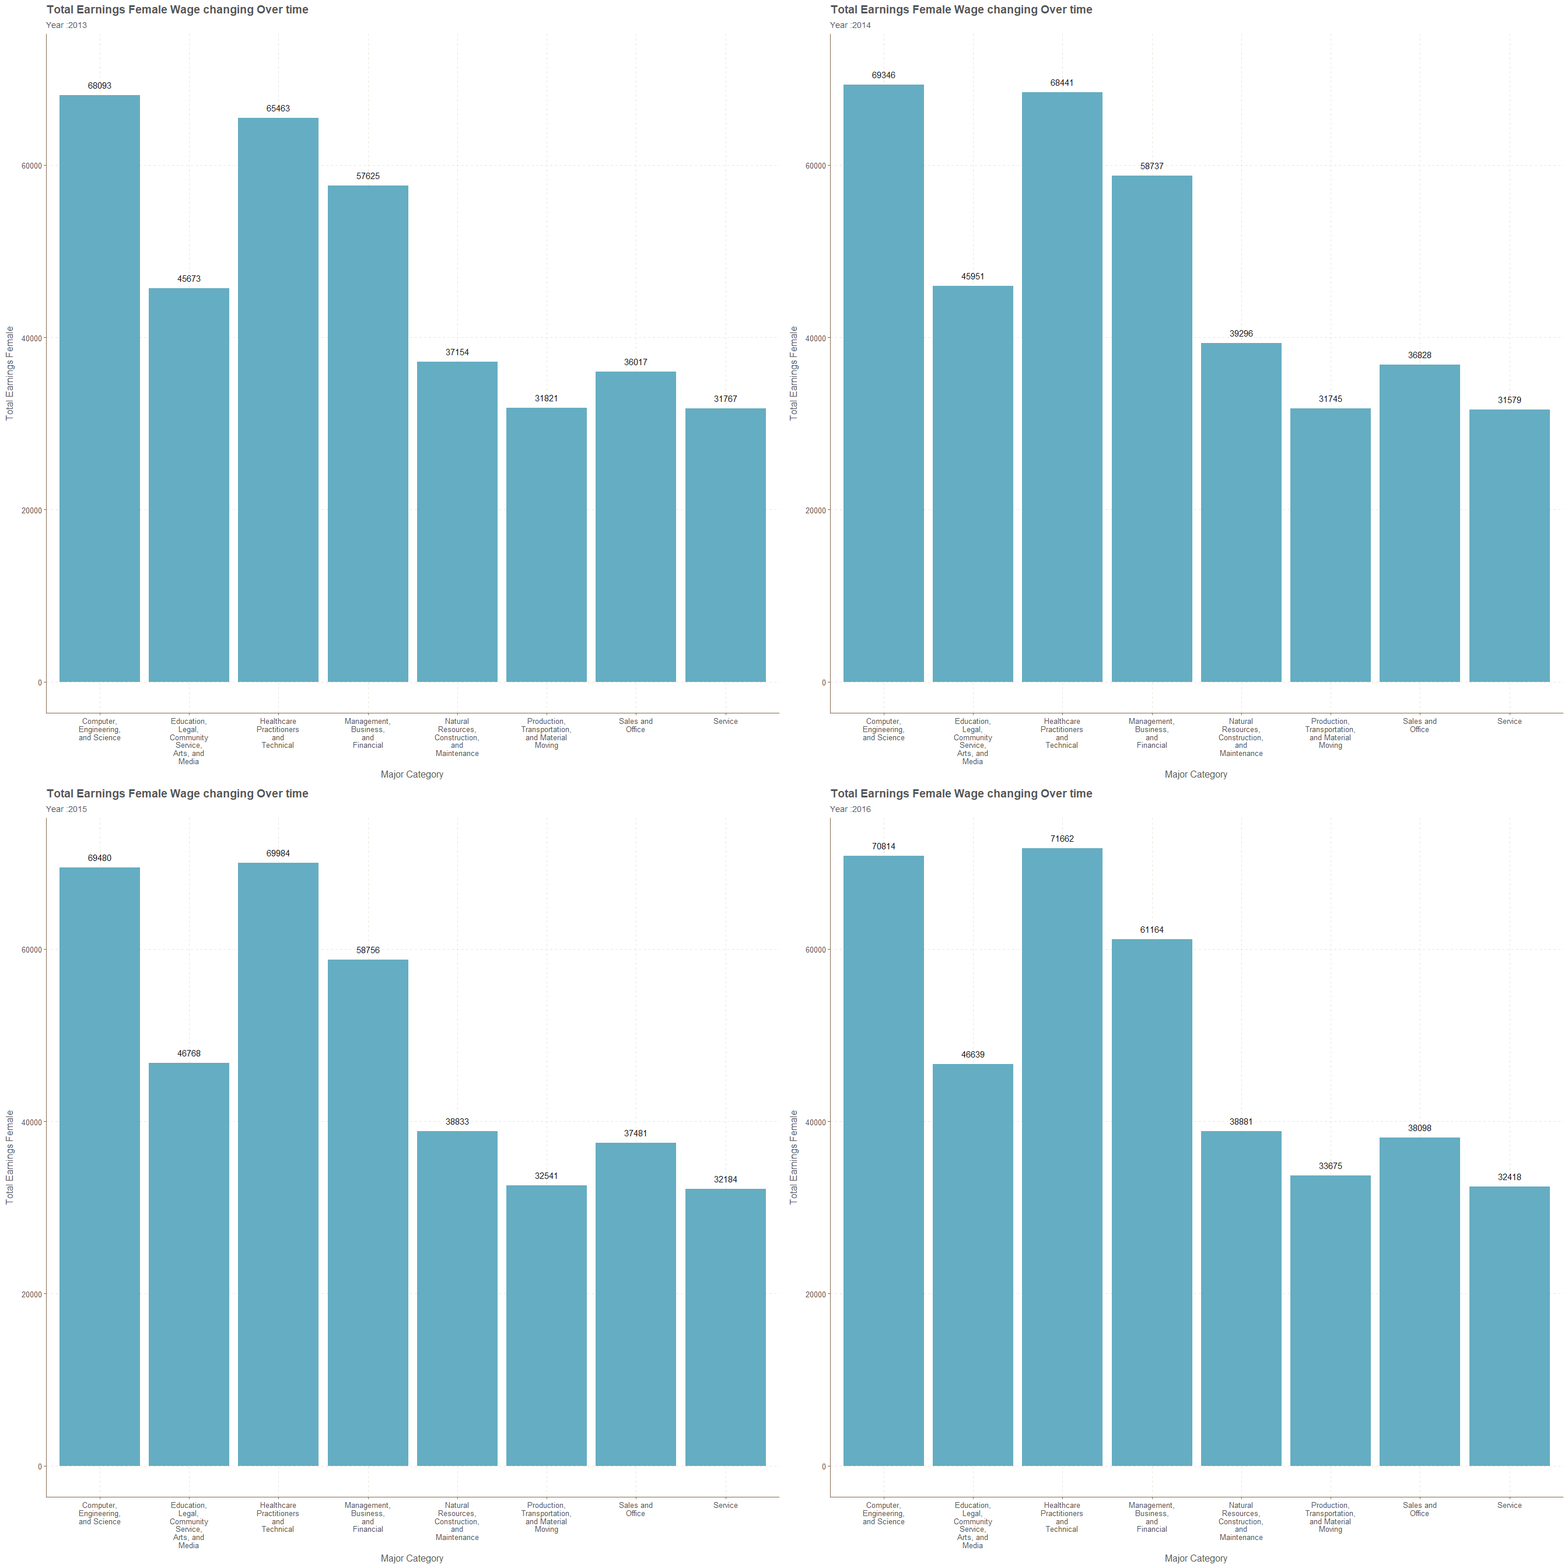
Major Category and Wage Percent for Female relative to Male
p<-jobs_gender %>%
     select(-one_of(c("occupation","minor_category"))) %>%
     group_by(year,major_category) %>%
     summarise_all(funs(mean),na.rm=TRUE) %>%
ggplot(.,aes(str_wrap(major_category,12),wage_percent_of_male,
             label=round(wage_percent_of_male,2)))+
  geom_col()+transition_time(year)+ease_aes("linear")+
  ggtitle("Wage Percent of Female relative to Male changing Over time",
          subtitle = "Year :{frame_time}")+
  xlab("Major Category")+ylab("Relative Percentage")+geom_text(vjust=-1)

animate(p,nframes=4,fps=1)
Minor Category
Minor Category and Total Workers
p<-jobs_gender %>%
     select(-one_of(c("occupation","major_category"))) %>%
     group_by(year,minor_category) %>%
     summarise_all(funs(mean),na.rm=TRUE) %>%
ggplot(.,aes(str_wrap(minor_category,20),total_workers,label=round(total_workers,2)))+
  geom_col()+transition_time(year)+ease_aes("linear")+coord_flip()+
  ggtitle("Total Workers changing Over time",subtitle = "Year :{frame_time}")+
  xlab("Minor Category")+ylab("Total Workers")+geom_text(hjust="inward")

animate(p,nframes=4,fps=1)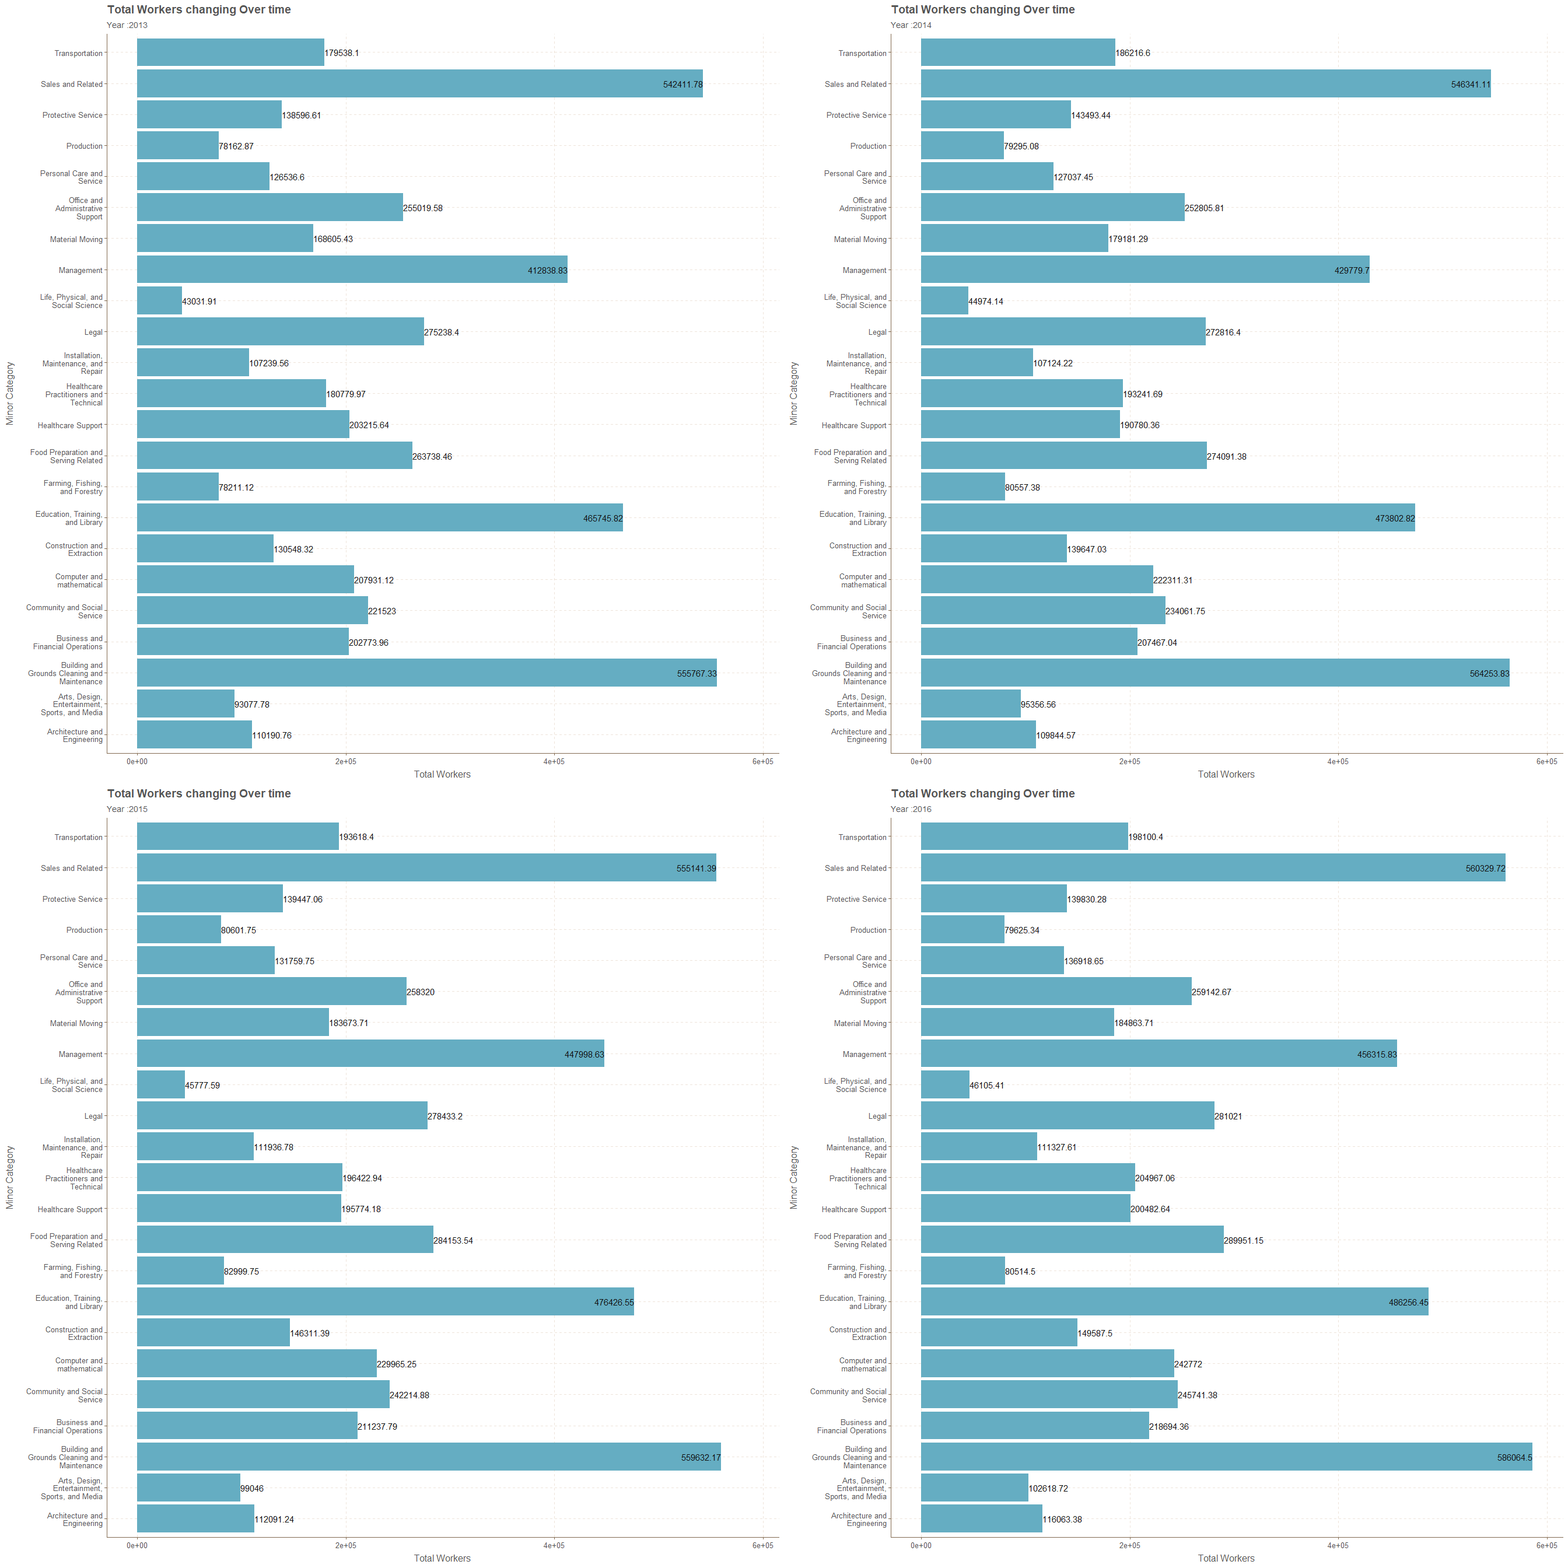
Minor Category and Male Workers
p<-jobs_gender %>%
     select(-one_of(c("occupation","major_category"))) %>%
     group_by(year,minor_category) %>%
     summarise_all(funs(mean),na.rm=TRUE) %>%
ggplot(.,aes(str_wrap(minor_category,20),workers_male,label=round(workers_male,2)))+
  geom_col()+transition_time(year)+ease_aes("linear")+coord_flip()+
  ggtitle("Male Workers changing Over time",subtitle = "Year :{frame_time}")+
  xlab("Minor Category")+ylab("Male Workers")+geom_text(hjust="inward")

animate(p,nframes=4,fps=1)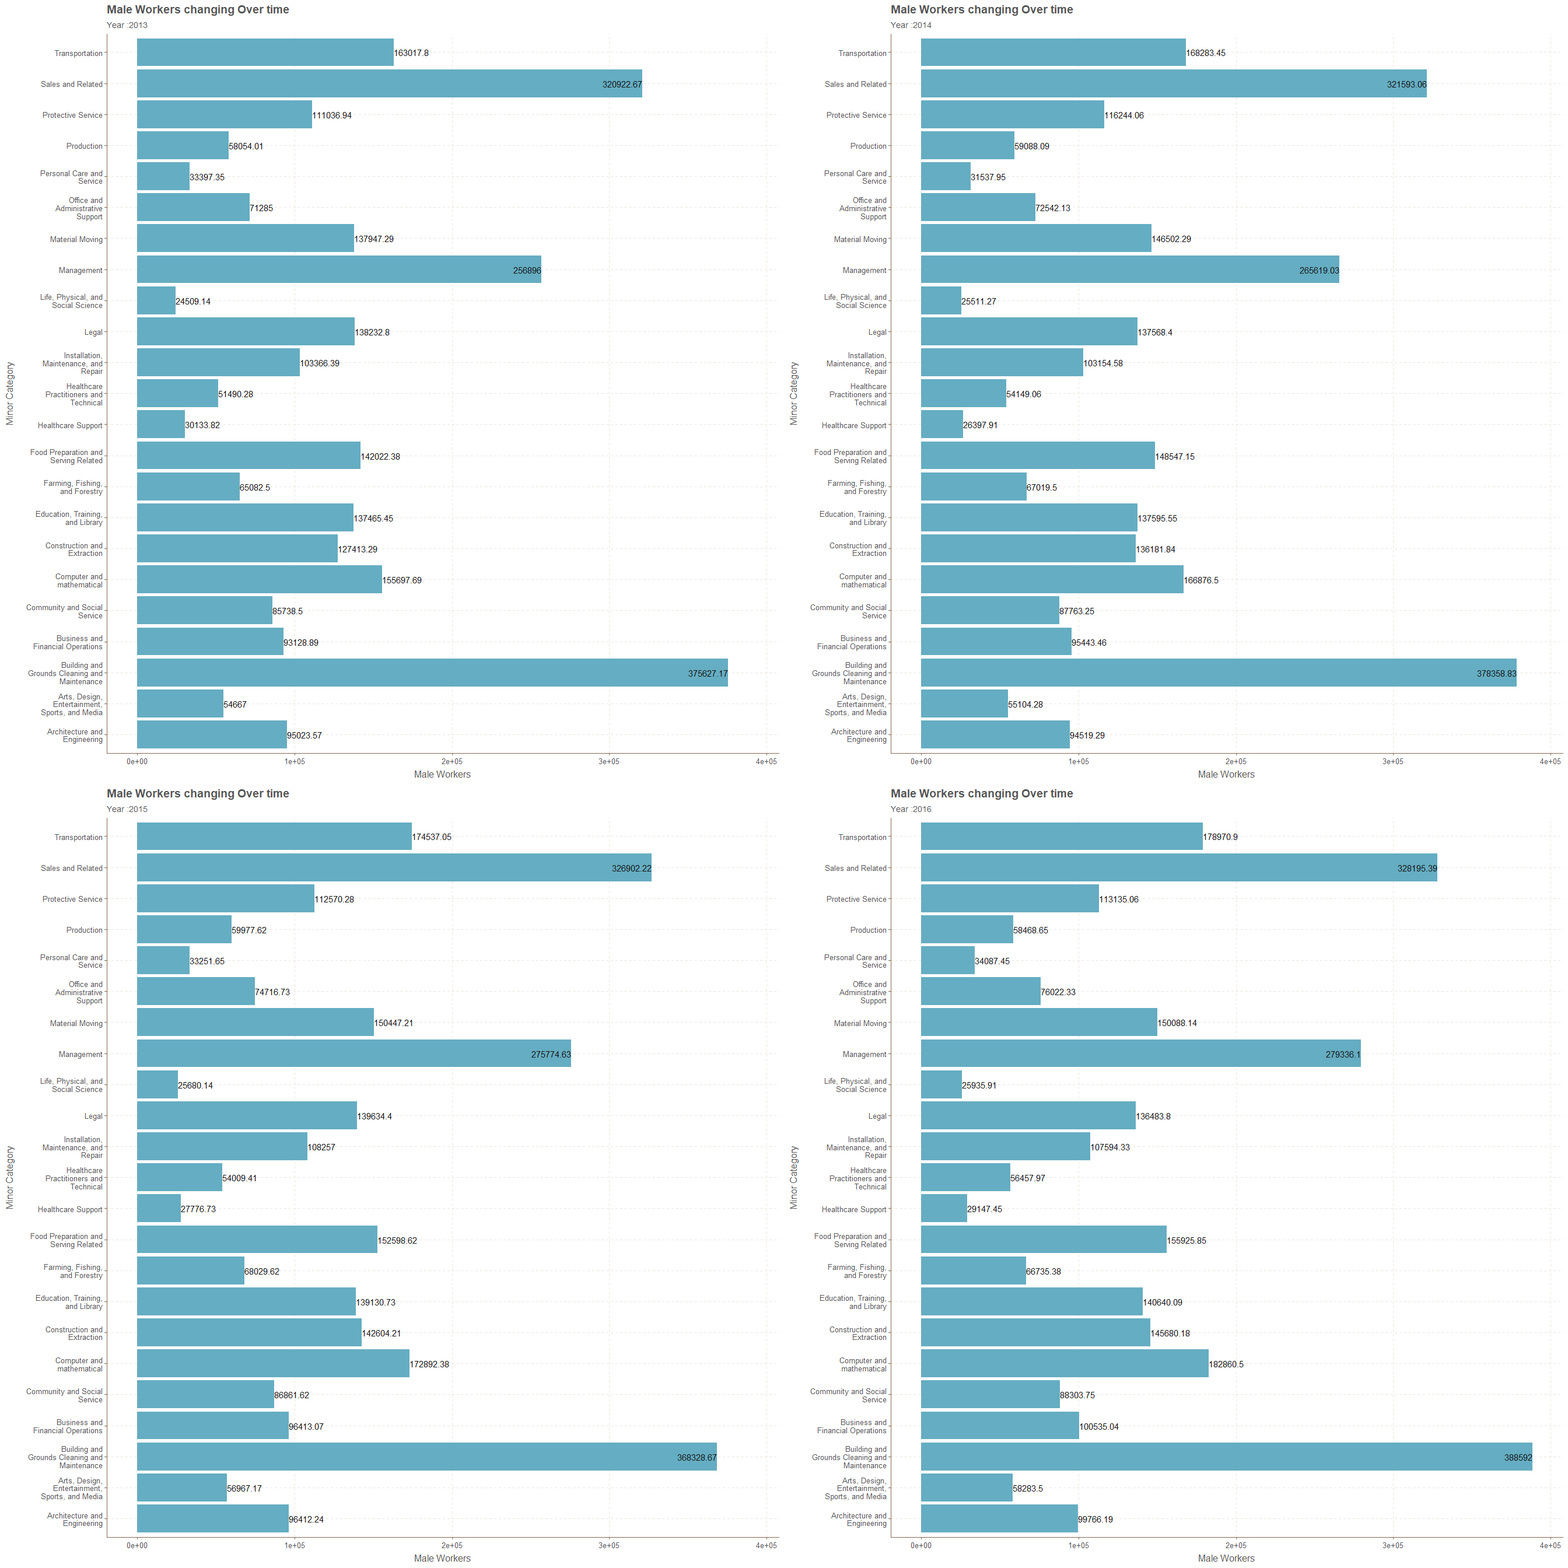
Minor Category and Female Workers
p<-jobs_gender %>%
     select(-one_of(c("occupation","major_category"))) %>%
     group_by(year,minor_category) %>%
     summarise_all(funs(mean),na.rm=TRUE) %>%
ggplot(.,aes(str_wrap(minor_category,20),workers_female,label=round(workers_female,2)))+
  geom_col()+transition_time(year)+ease_aes("linear")+coord_flip()+
  ggtitle("Female Workers changing Over time",subtitle = "Year :{frame_time}")+
  xlab("Minor Category")+ylab("Female Workers")+geom_text(hjust="inward")

animate(p,nframes=4,fps=1)
Minor Category and Total Earnings Male Wage
p<-jobs_gender %>%
     select(-one_of(c("occupation","major_category"))) %>%
     group_by(year,minor_category) %>%
     summarise_all(funs(mean),na.rm=TRUE) %>%
ggplot(.,aes(str_wrap(minor_category,20),total_earnings_male,label=round(total_earnings_male,2)))+
  geom_col()+transition_time(year)+ease_aes("linear")+coord_flip()+
  ggtitle("Total Earnings Male Wage changing Over time",subtitle = "Year :{frame_time}")+
  xlab("Minor Category")+ylab("Total earnings Male")+geom_text(hjust="inward")

animate(p,nframes=4,fps=1)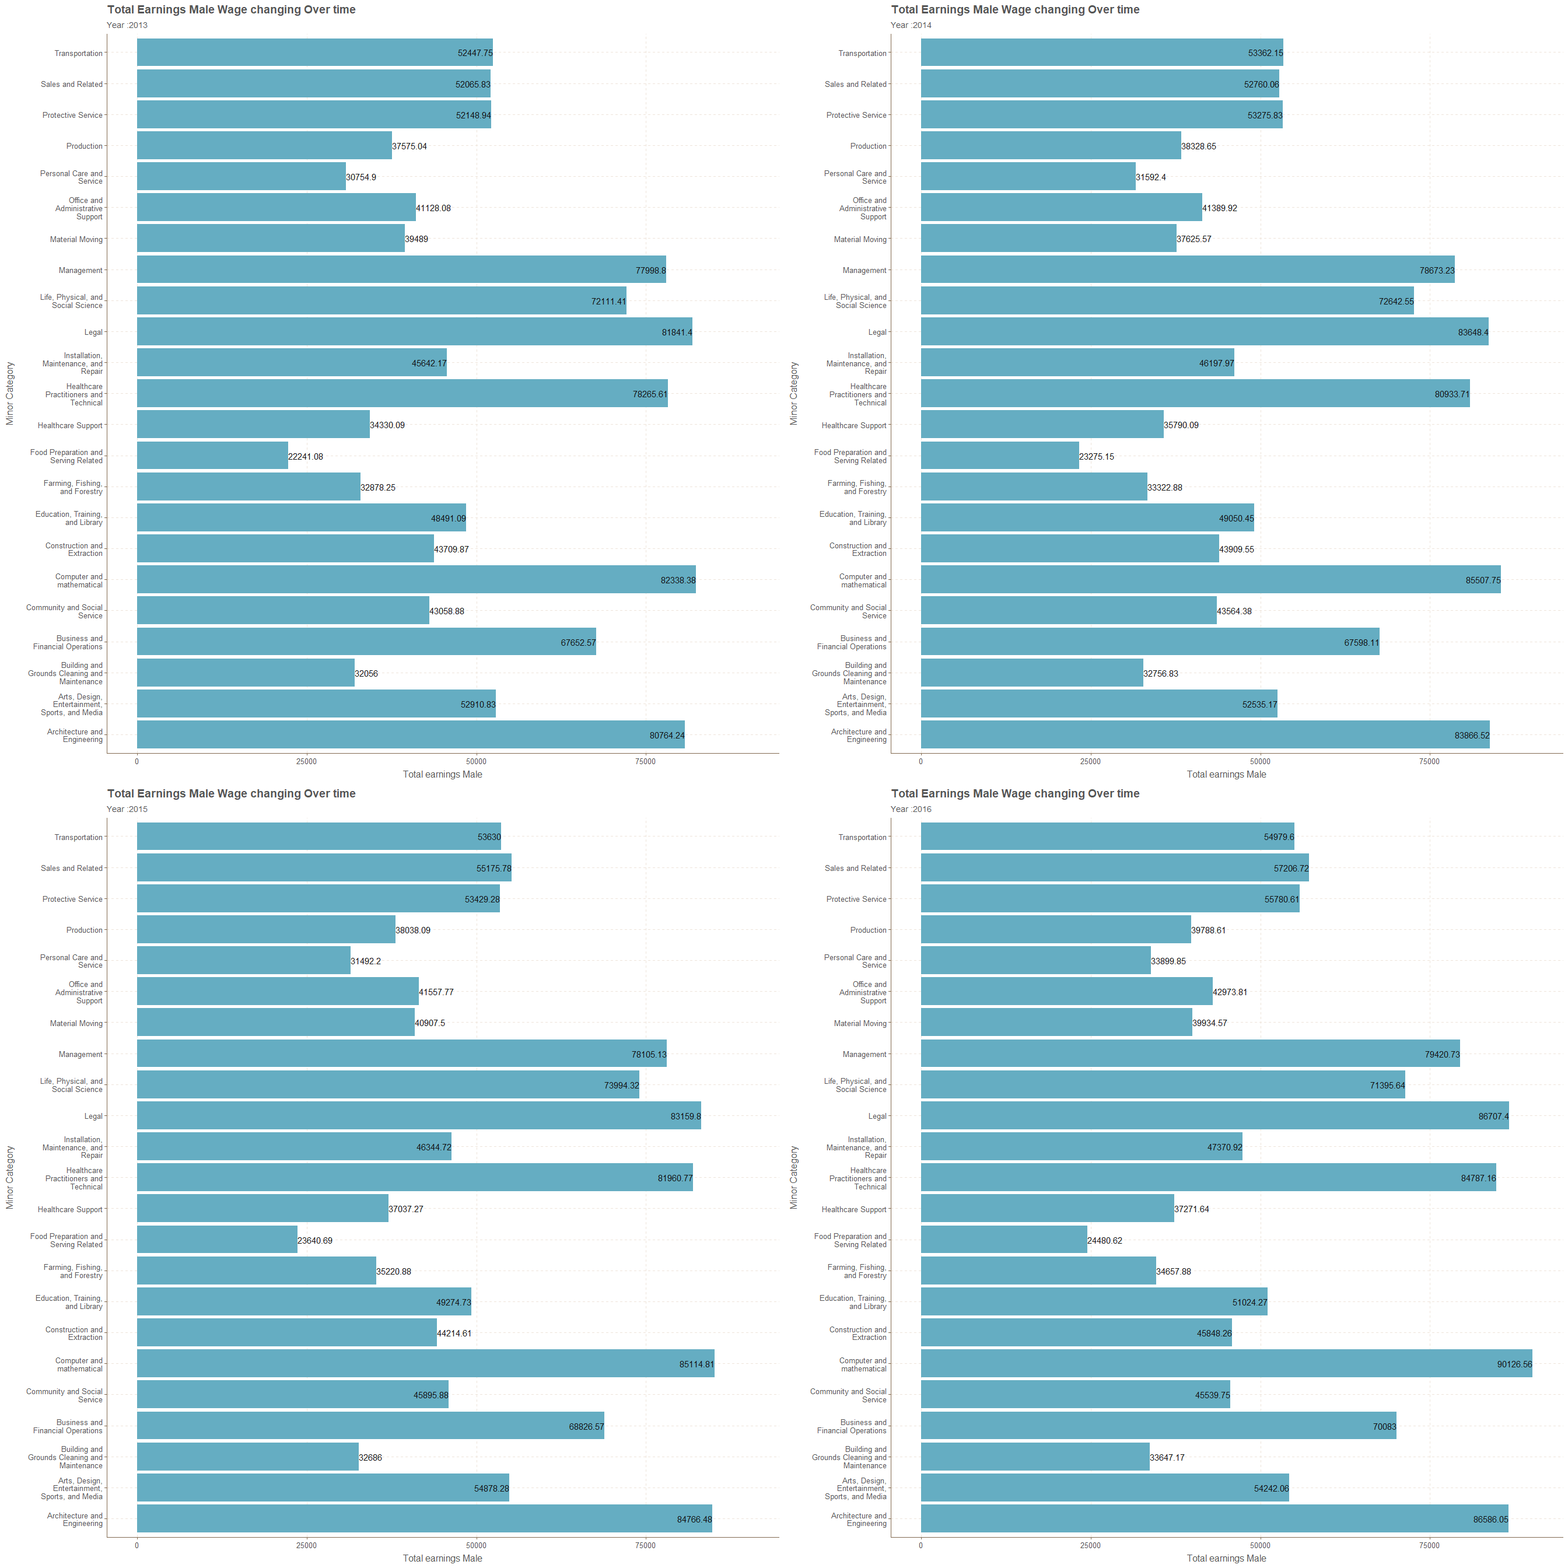
Minor Category and Total Earnings Female Wage
p<-jobs_gender %>%
     select(-one_of(c("occupation","major_category"))) %>%
     group_by(year,minor_category) %>%
     summarise_all(funs(mean),na.rm=TRUE) %>%
ggplot(.,aes(str_wrap(minor_category,20),total_earnings_female,label=round(total_earnings_female,2)))+
  geom_col()+transition_time(year)+ease_aes("linear")+coord_flip()+
  ggtitle("Total Earnings Female Wage changing Over time",subtitle = "Year :{frame_time}")+
  xlab("Minor Category")+ylab("Total earnings Female")+geom_text(hjust="inward")

animate(p,nframes=4,fps=1)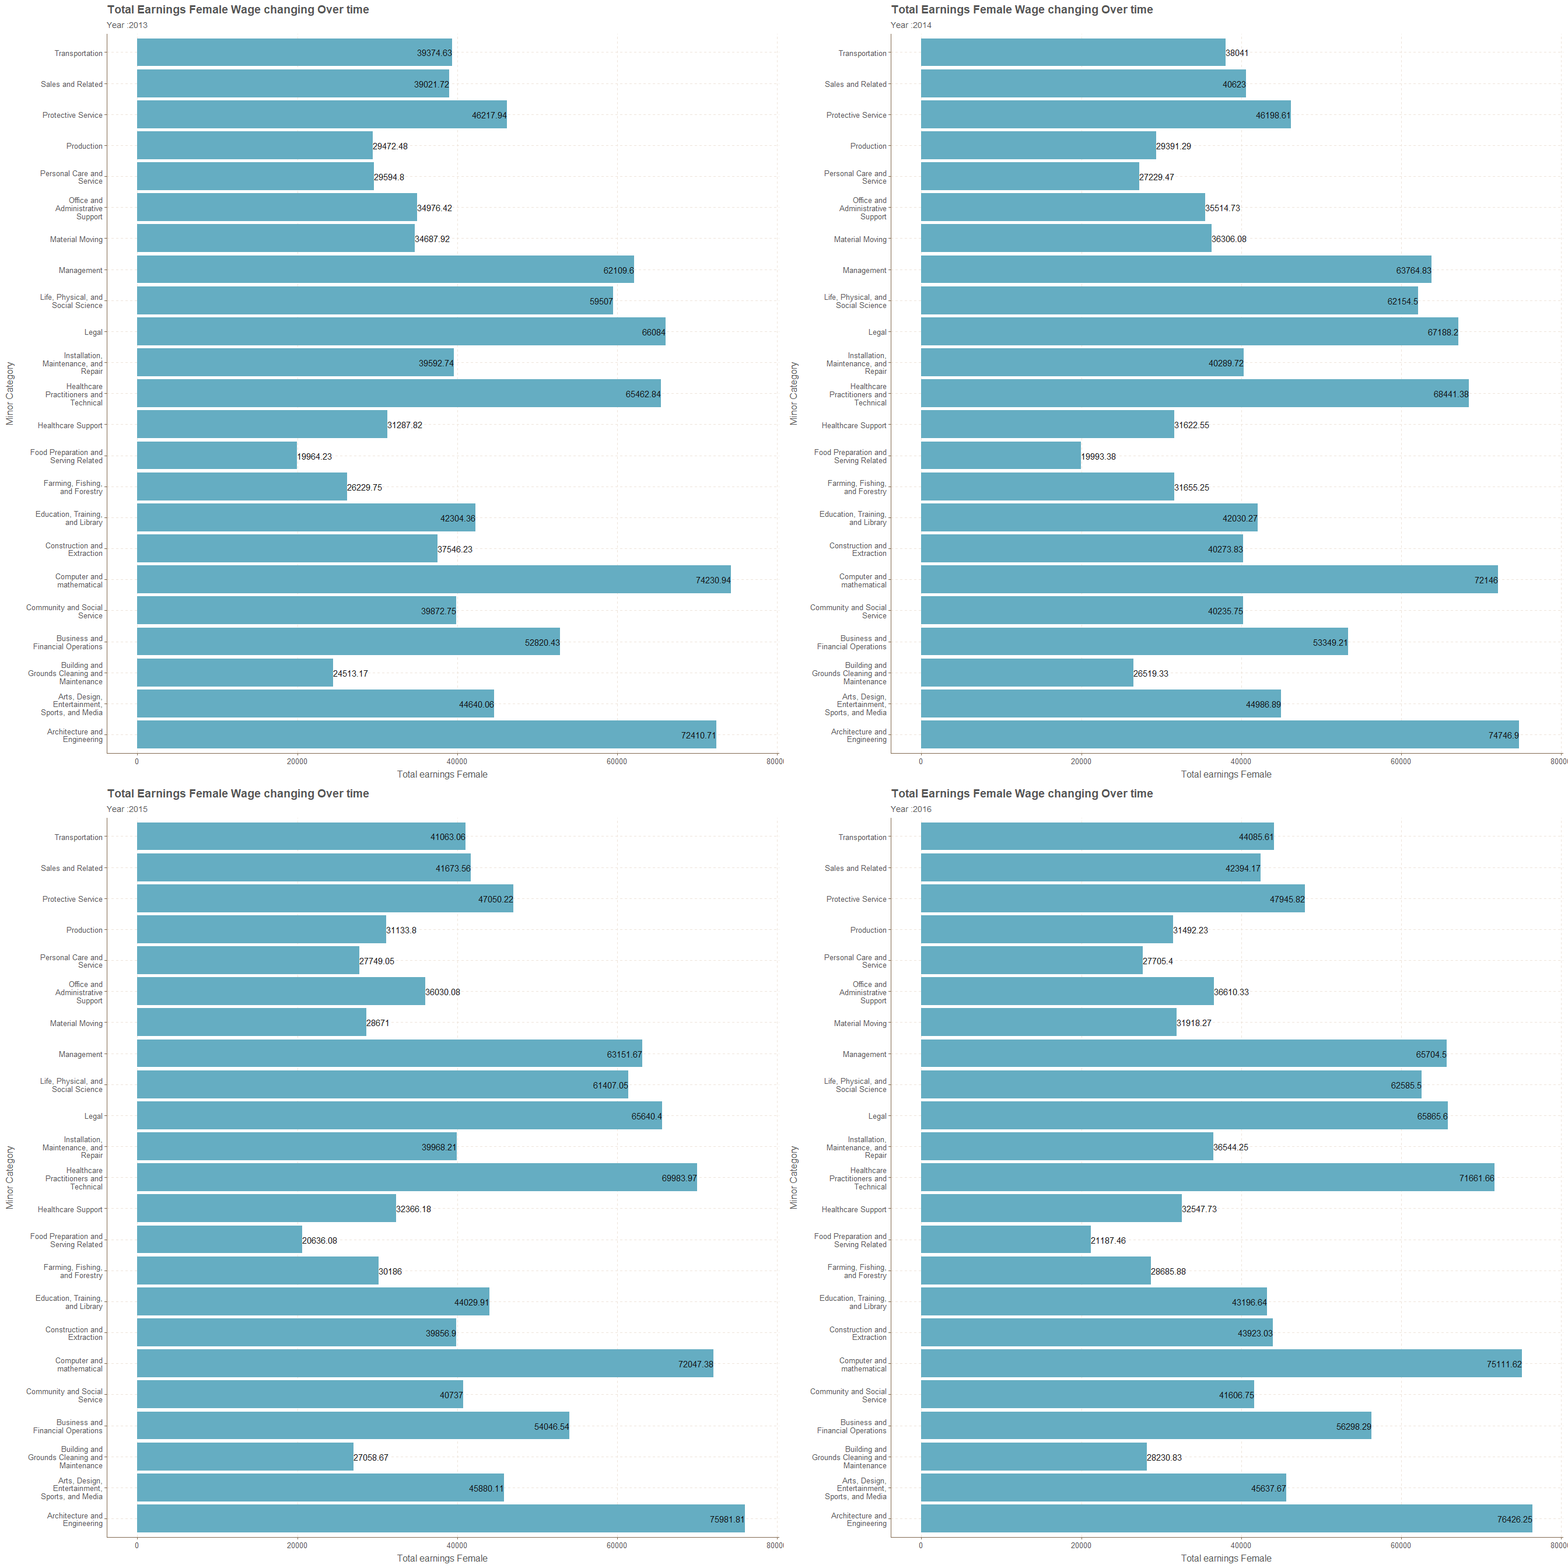
Minor Category and Wage Percent for Female relative to Male
p<-jobs_gender %>%
     select(-one_of(c("occupation","major_category"))) %>%
     group_by(year,minor_category) %>%
     summarise_all(funs(mean),na.rm=TRUE) %>%
ggplot(.,aes(str_wrap(minor_category,18),wage_percent_of_male,
             label=round(wage_percent_of_male,2)))+
  geom_col()+transition_time(year)+ease_aes("linear")+
  ggtitle("Wage Percent of Female relative to Male changing Over time",
          subtitle = "Year :{frame_time}")+coord_flip()+
  xlab("Minor Category")+ylab("Relative Percentage")+geom_text(hjust=1)

animate(p,nframes=4,fps=1)
THANK YOU