Week 23 : Ramen Ratings
TidyTuesday
2019
I have not posted regarding #TidyTuesday in a while, so here it is. It is all about manipulating the dataset and generating necessary plots.
{{% tweet "1136303490978988033" %}}
ramen_ratings %>%
  count(stars,sort = TRUE) %>%
ggplot(.,aes(fct_inorder(as_factor(stars)),n,label=n))+
      geom_col(fill=blues9[5])+
      geom_text(vjust=-0.5,color=blues9[9])+ylab("Count / Frequency")+
      xlab("Stars")+ggtitle("Stars Distribution")+
      theme_economist()+
      theme(axis.text.x = element_text(angle = 45))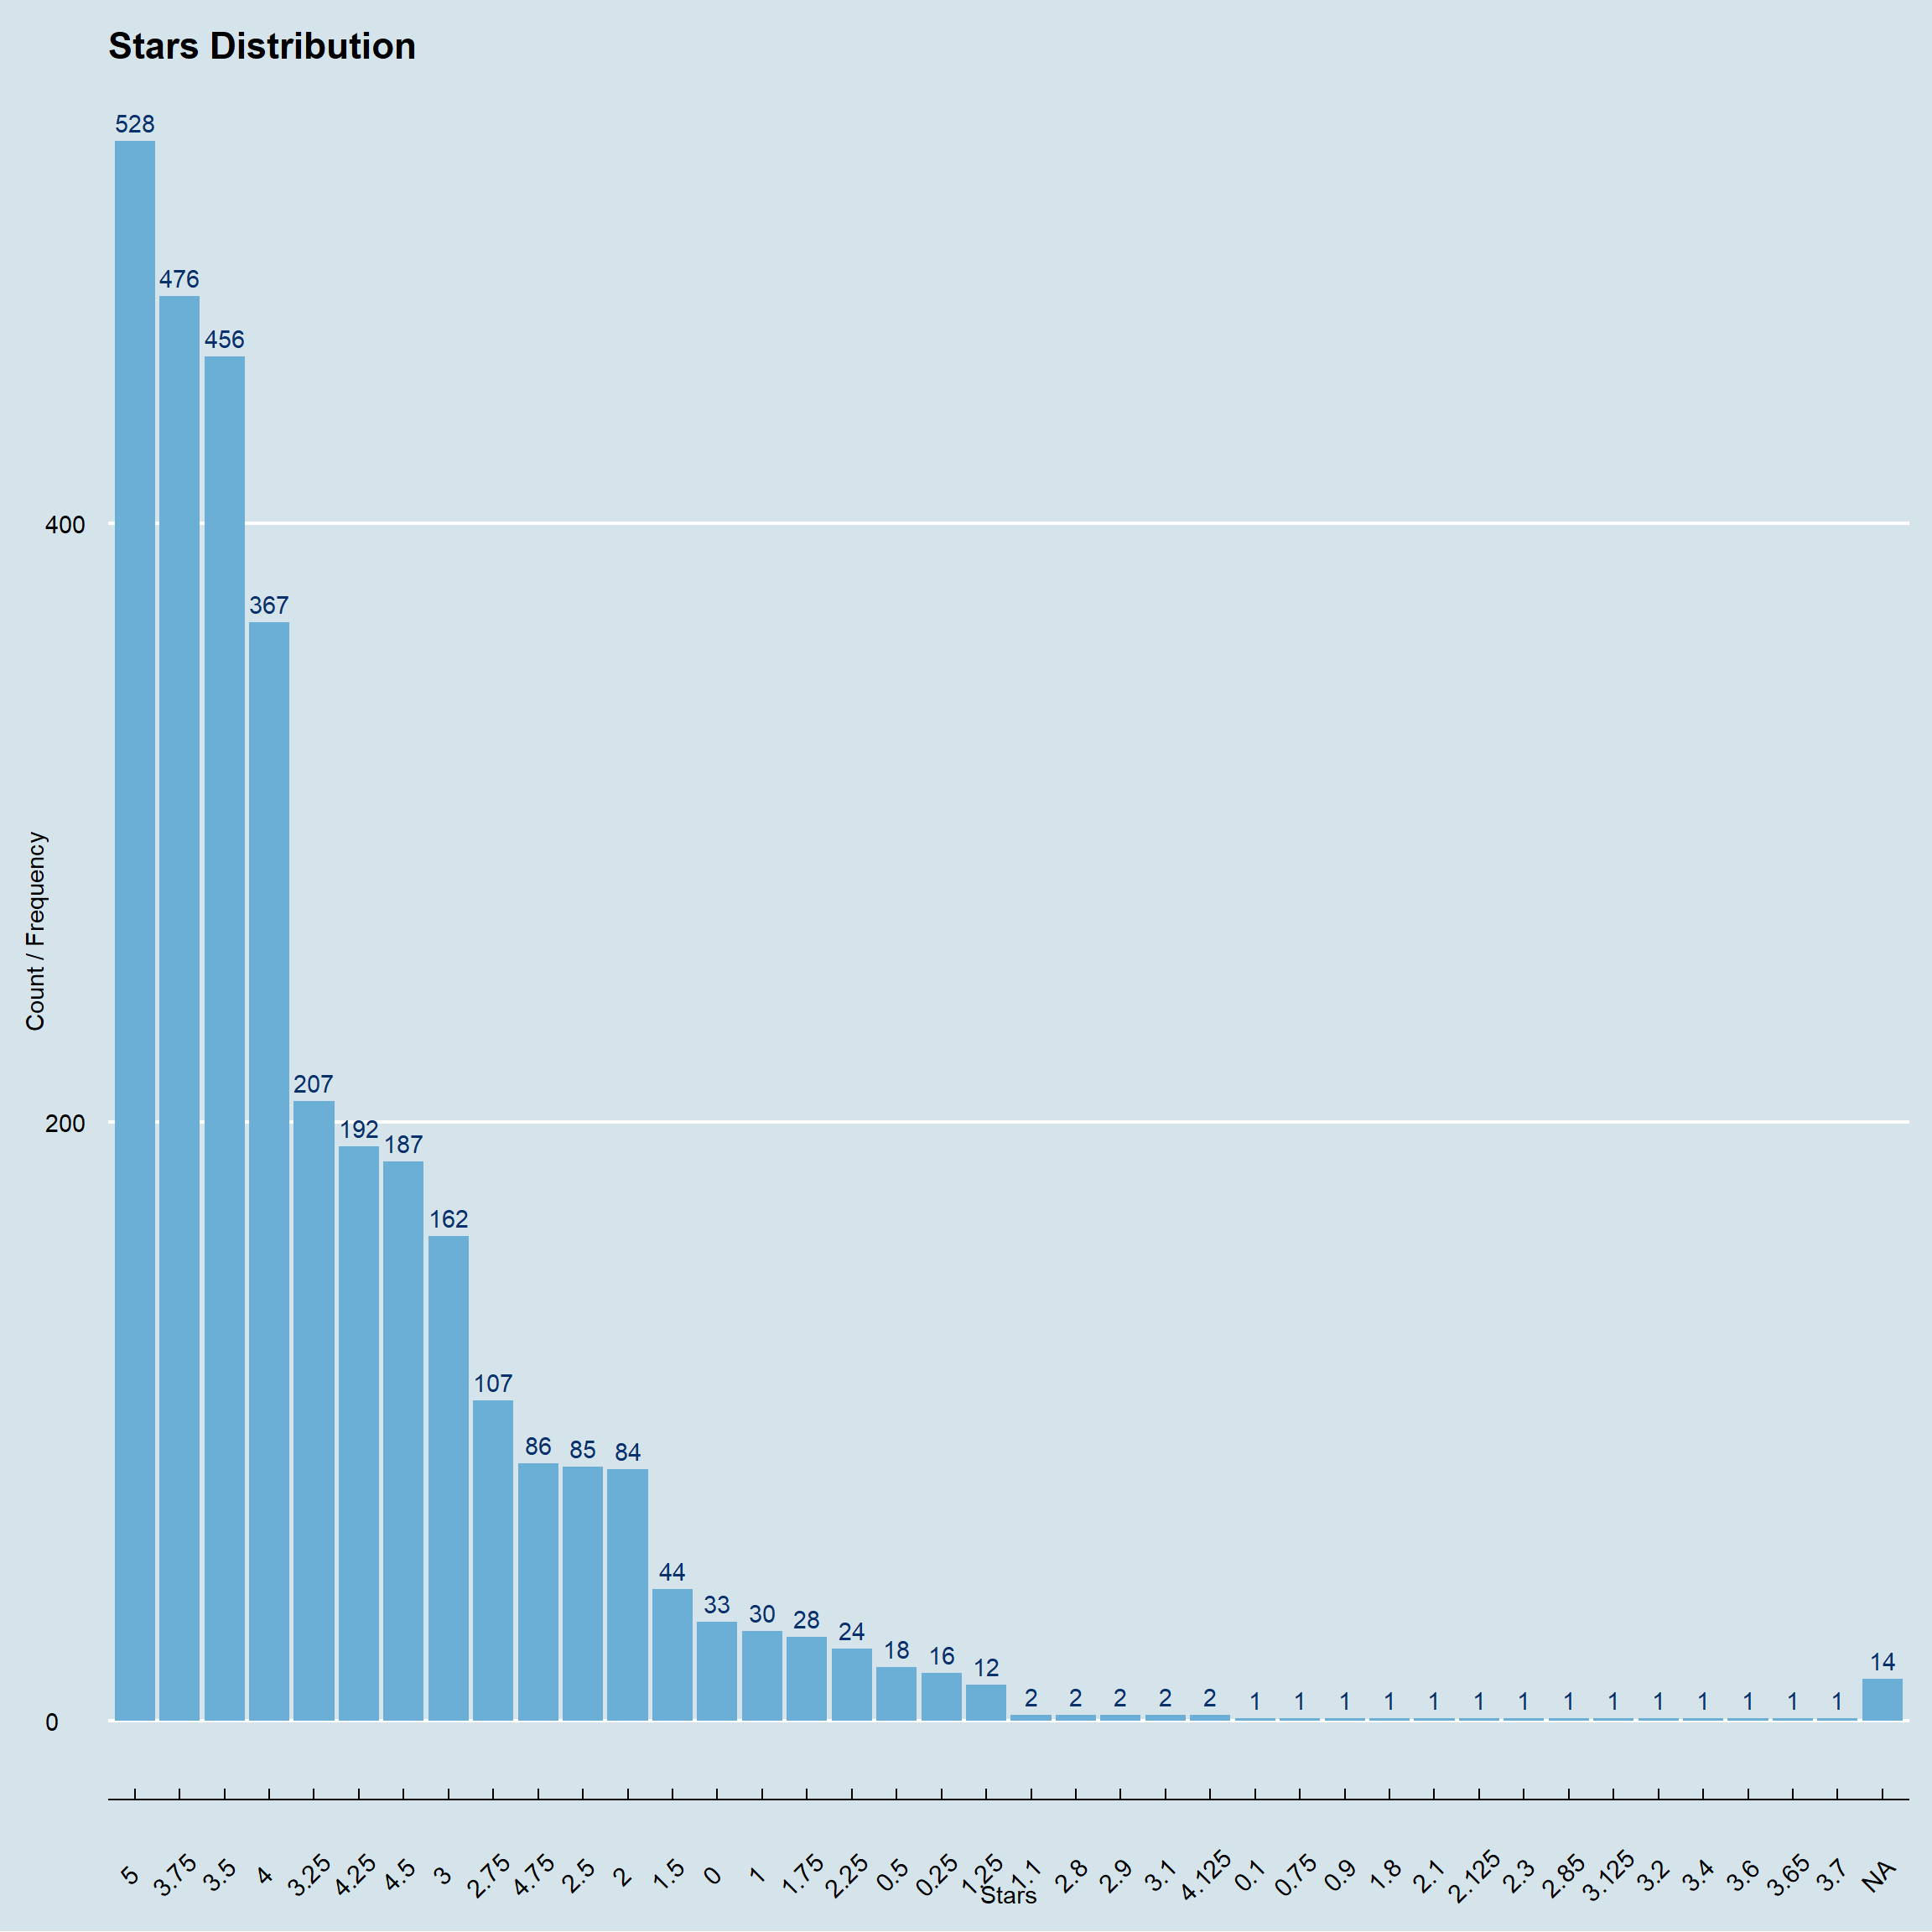
Brand versus Stars
Rating where stars is 4 or above 4
ramen_ratings %>%
  subset(stars >=4)%>%
  count(brand,sort = TRUE) %>%
  top_n(25) %>%
ggplot(.,aes(x=fct_inorder(brand),y=n,label=n))+geom_col(fill=blues9[5])+
      ylab("Count / Frequency")+xlab("Brand")+
      geom_text(hjust=-0.5,color=blues9[9])+
      ggtitle("Brands Distribution by Stars",
              subtitle = "Top 25")+
      theme_economist()+ coord_flip()
Rating where stars is below 2
ramen_ratings %>%
  subset(stars < 2)%>%
  count(brand,sort = TRUE) %>%
  top_n(25) %>%
ggplot(.,aes(x=fct_inorder(brand),y=n,label=n))+geom_col(fill=blues9[5])+
      ylab("Count / Frequency")+xlab("Brand")+
      geom_text(hjust=-0.5,color=blues9[9])+
      ggtitle("Brands Distribution by Stars",
              subtitle = "Top 25")+
      theme_economist()+ coord_flip()
Style versus Stars
Rating where stars is 4 or above 4
ramen_ratings %>%
  subset(stars >=4)%>%
  count(style,sort = TRUE) %>%
  top_n(10) %>%
ggplot(.,aes(x=fct_inorder(style),y=n,label=n))+geom_col(fill=blues9[5])+
      ylab("Count / Frequency")+xlab("Style")+
      geom_text(hjust=-0.5,color=blues9[9])+
      ggtitle("Styles Distribution by Stars",
              subtitle = "Top 10")+
      theme_economist()+ coord_flip()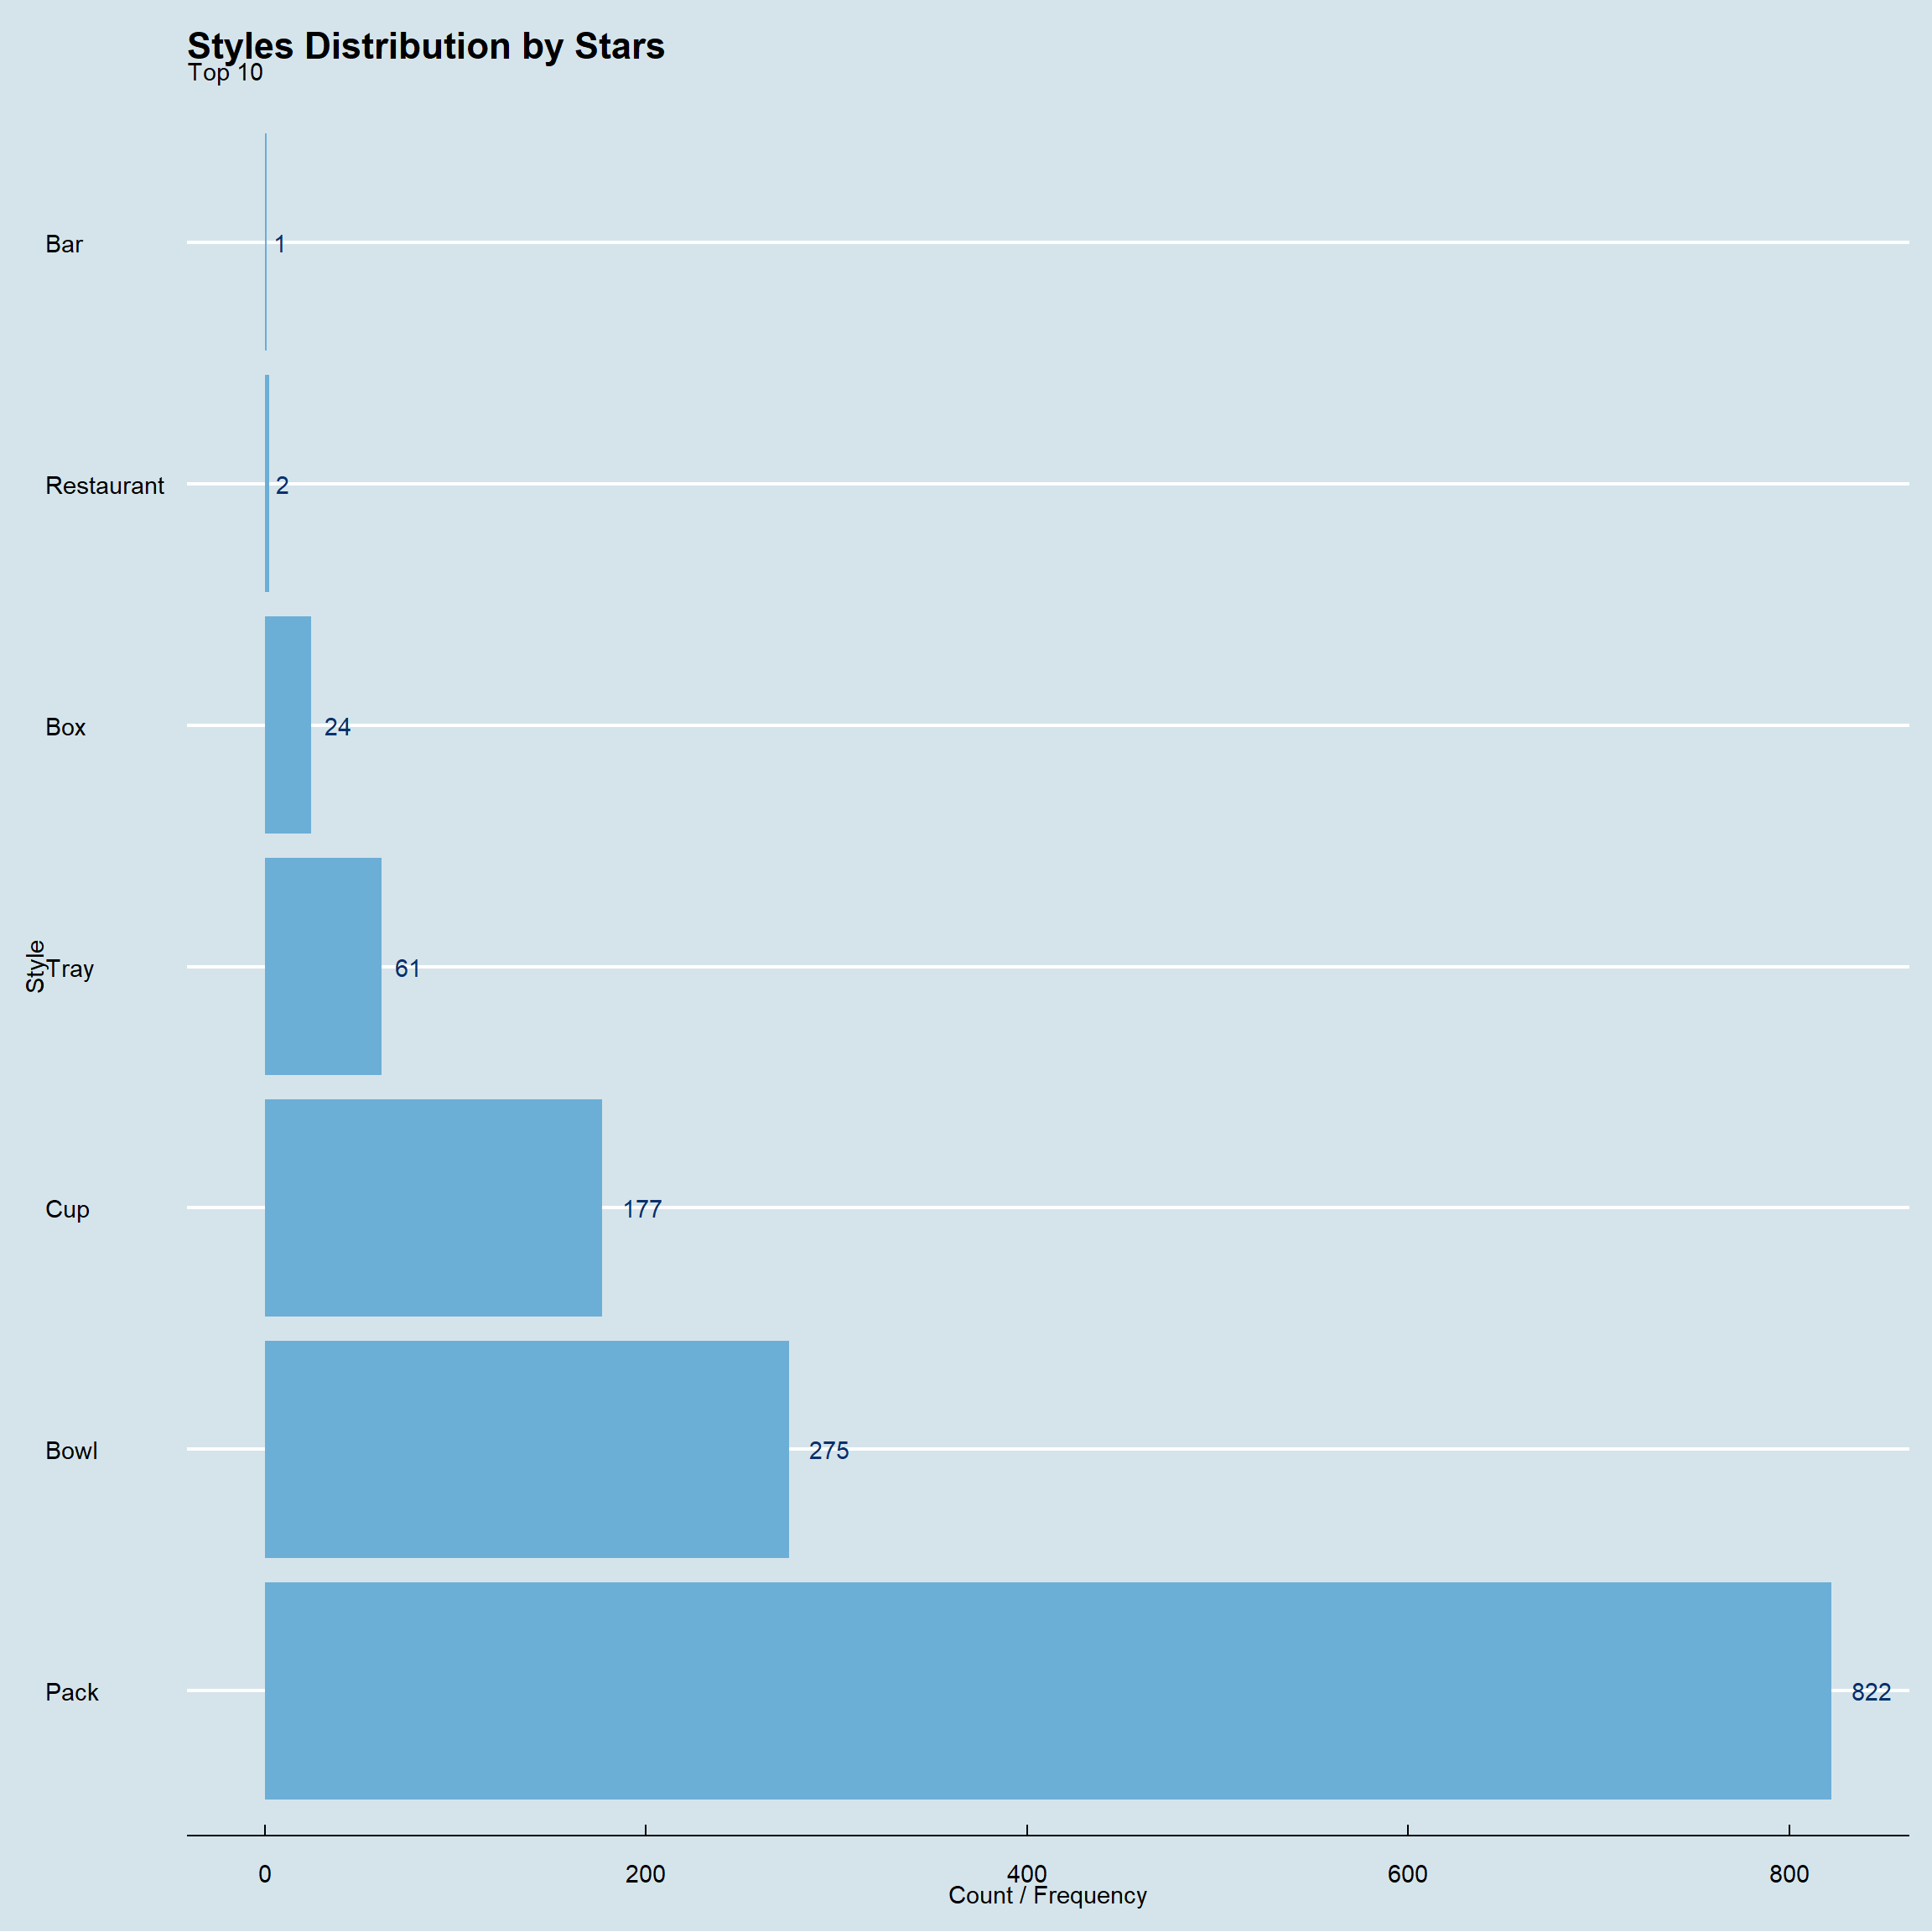
Rating where stars is below 2
ramen_ratings %>%
  subset(stars < 2)%>%
  count(style,sort = TRUE) %>%
  top_n(5) %>%
ggplot(.,aes(x=fct_inorder(style),y=n,label=n))+geom_col(fill=blues9[5])+
      ylab("Count / Frequency")+xlab("Style")+
      geom_text(hjust=-0.5,color=blues9[9])+
      ggtitle("Styles Distribution by Stars",
              subtitle = "Top 5")+
      theme_economist()+ coord_flip()
Country versus Stars
Rating where stars is 4 or above 4
ramen_ratings %>%
  subset(stars >=4)%>%
  count(country,sort = TRUE) %>%
  top_n(25) %>%
ggplot(.,aes(x=fct_inorder(country),y=n,label=n))+geom_col(fill=blues9[5])+
      ylab("Count / Frequency")+xlab("Country")+
      geom_text(hjust=-0.5,color=blues9[9])+
      ggtitle("Countries Distribution by Stars",
              subtitle = "Top 25")+
      theme_economist()+ coord_flip()
Rating where stars is below 2
ramen_ratings %>%
  subset(stars < 2)%>%
  count(country,sort = TRUE) %>%
  top_n(25) %>%
ggplot(.,aes(x=fct_inorder(country),y=n,label=n))+geom_col(fill=blues9[5])+
      ylab("Count / Frequency")+xlab("Country")+
      geom_text(hjust=-0.5,color=blues9[9])+
      ggtitle("Countries Distribution by Stars",
              subtitle = "Top 20")+
      theme_economist()+ coord_flip()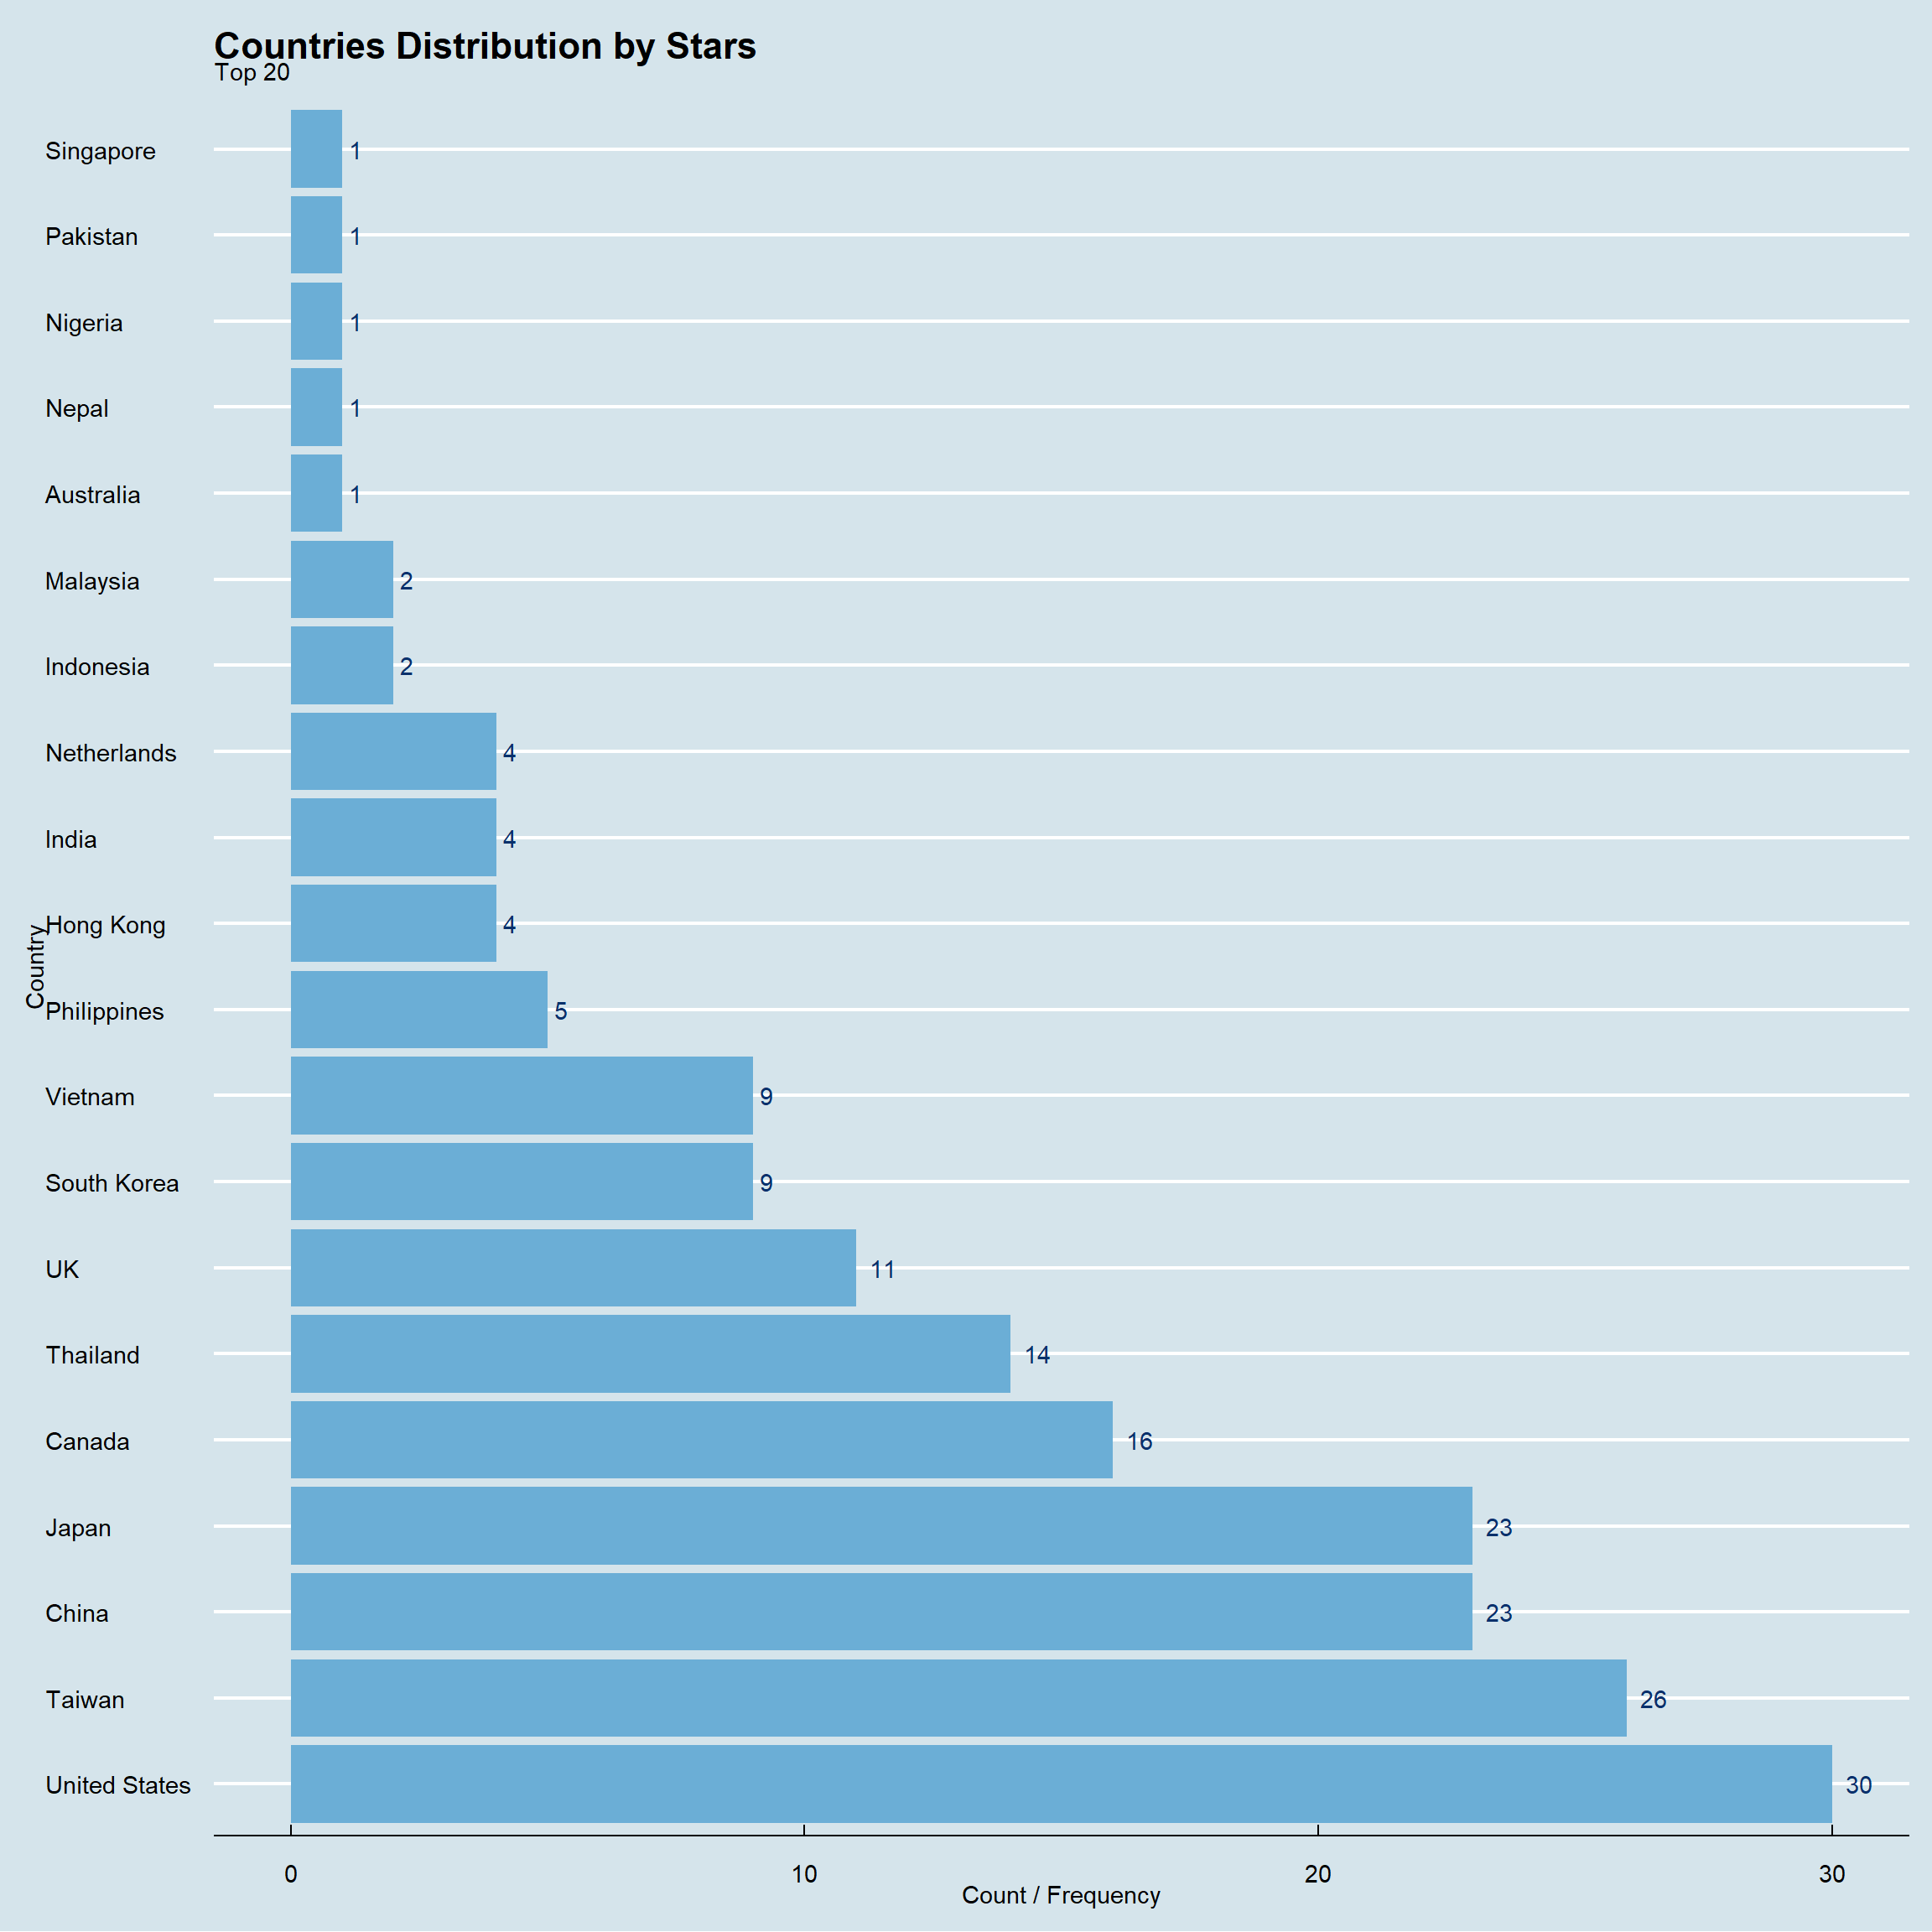
Brand and Style versus Stars
Rating where stars is 4 or above 4
ramen_ratings %>%
  subset(stars >=4)%>%
  count(brand,style,sort = TRUE) %>%
  top_n(25) %>%
ggplot(.,aes(x=fct_inorder(brand),y=n,label=n,fill=style))+
      geom_col(position = "dodge")+
      ylab("Count / Frequency")+xlab("Brand")+
      geom_text(hjust=-0.25,color=blues9[9],
                position = position_dodge(width = 1))+
      ggtitle("Brand Distribution by Stars but for Styles",
              subtitle = "Top 25")+
      theme_economist()+ coord_flip()
Rating where stars is below 2
ramen_ratings %>%
  subset(stars <2)%>%
  count(brand,style,sort = TRUE) %>%
  top_n(25) %>%
ggplot(.,aes(x=fct_inorder(brand),y=n,label=n,fill=style))+
      geom_col(position = "dodge")+
      ylab("Count / Frequency")+xlab("Brand")+
      geom_text(hjust=-0.25,color=blues9[9],
                position = position_dodge(width = 1))+
      ggtitle("Brand Distribution by Stars but for Styles",
              subtitle = "Top 25")+
      theme_economist()+ coord_flip()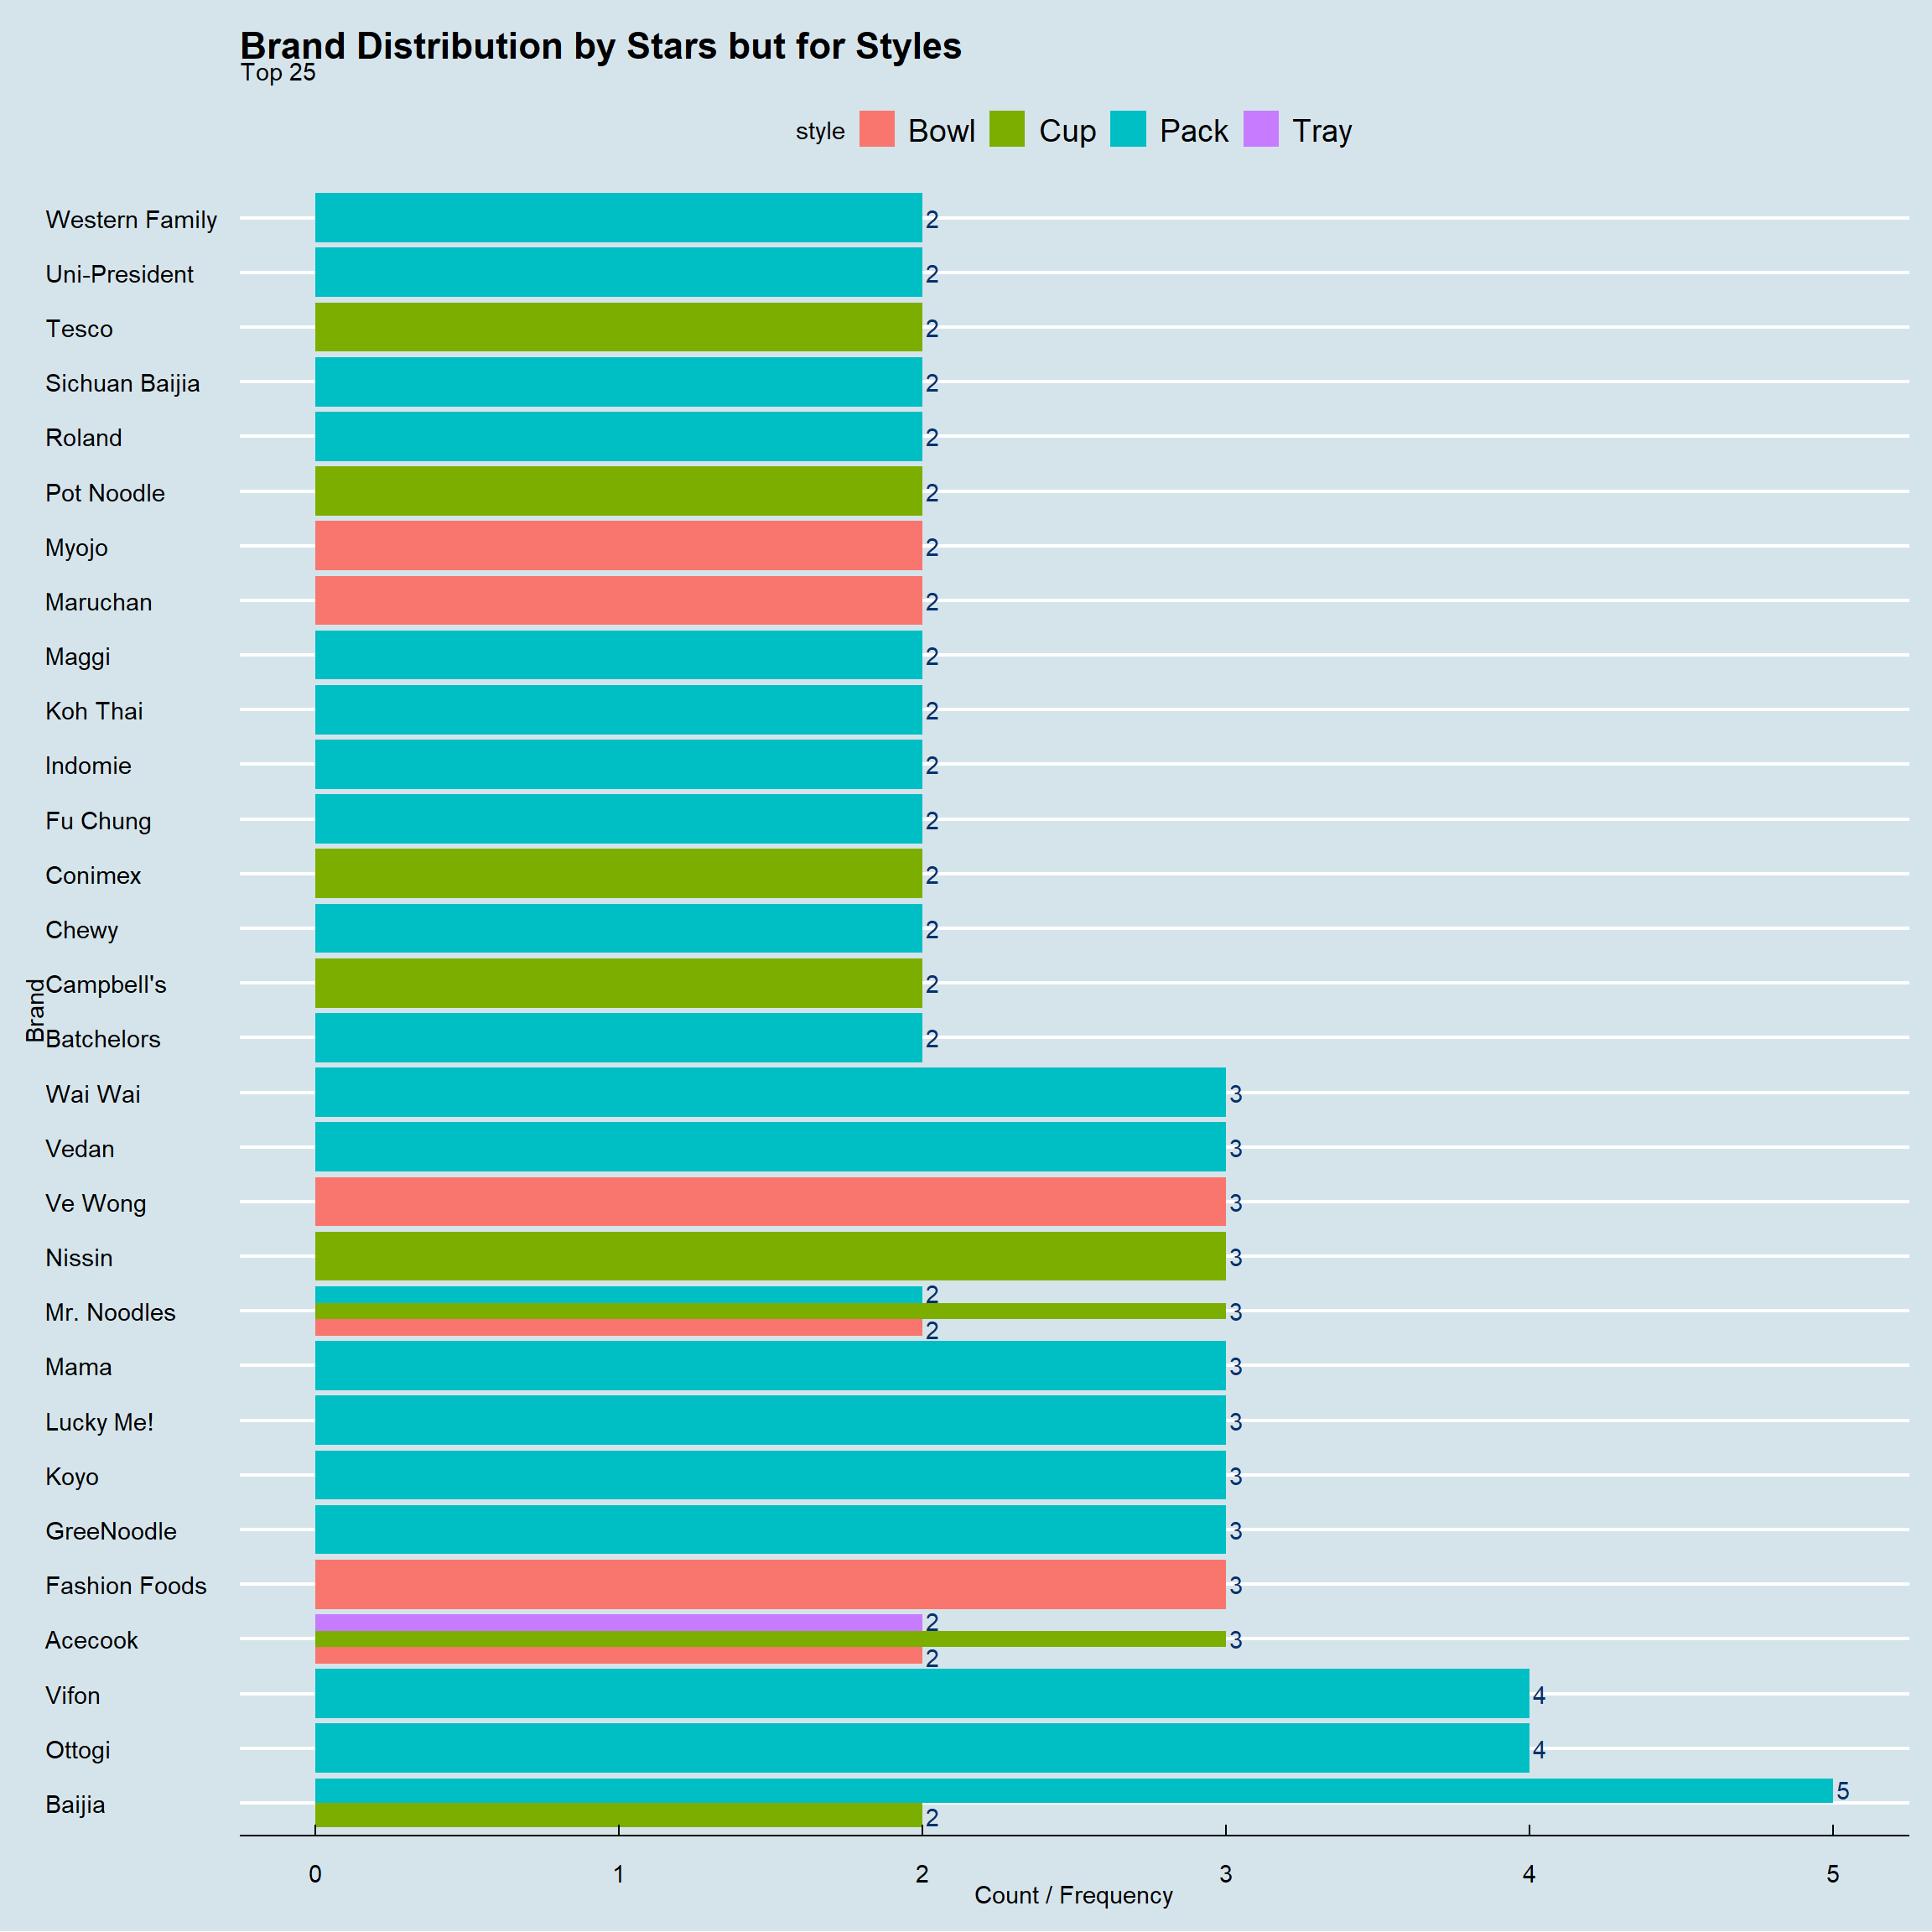
Brand and Country versus Stars
Rating where stars is 4 or above 4
ramen_ratings %>%
  subset(stars >=4)%>%
  count(brand,country,sort = TRUE) %>%
  top_n(25) %>%
ggplot(.,aes(x=fct_inorder(brand),y=n,label=n,fill=country))+
      geom_col(position = "dodge")+
      ylab("Count / Frequency")+xlab("Brand")+
      geom_text(hjust=-0.25,color=blues9[9],
                position = position_dodge(width = 1))+
      ggtitle("Brand Distribution by Stars but for Country",
              subtitle = "Top 25")+
      theme_economist()+ coord_flip()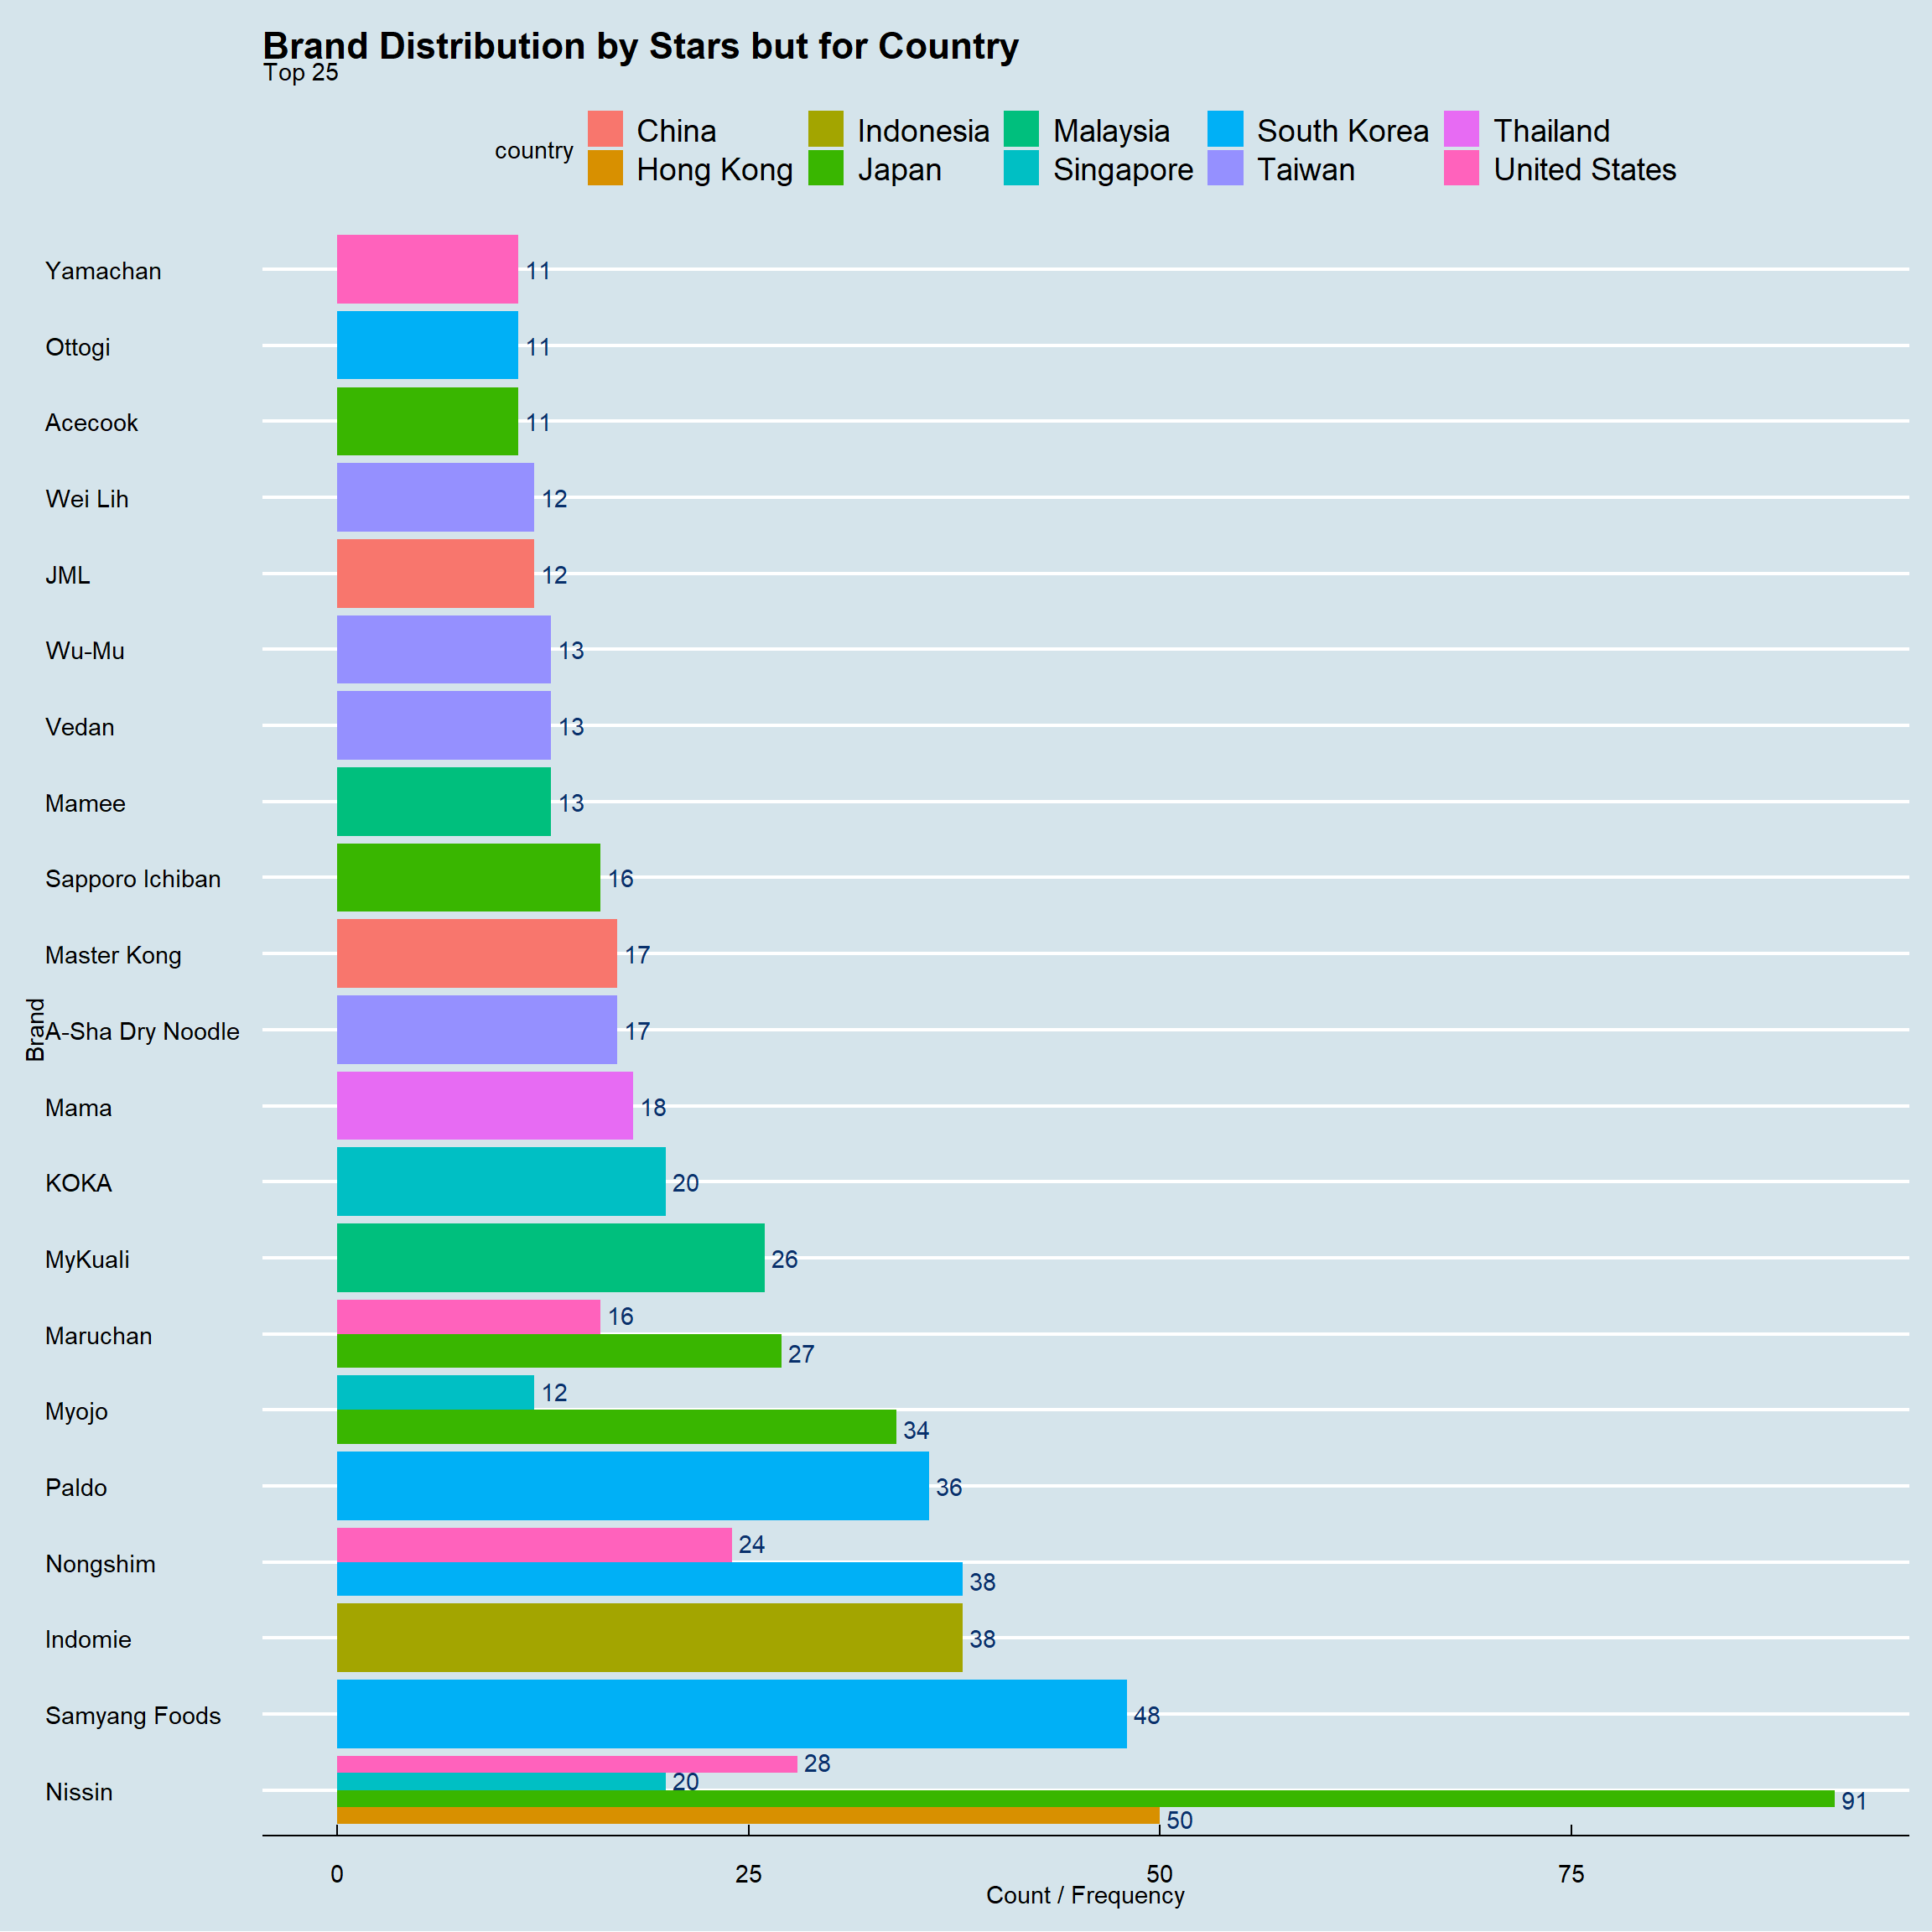
Rating where stars is below 2
ramen_ratings %>%
  subset(stars <2)%>%
  count(brand,country,sort = TRUE) %>%
  top_n(25) %>%
ggplot(.,aes(x=fct_inorder(brand),y=n,label=n,fill=country))+
      geom_col(position = "dodge")+
      ylab("Count / Frequency")+xlab("Brand")+
      geom_text(hjust=-0.25,color=blues9[9],
                position = position_dodge(width = 1))+
      ggtitle("Brand Distribution by Stars but for Country",
              subtitle = "Top 25")+
      theme_economist()+ coord_flip()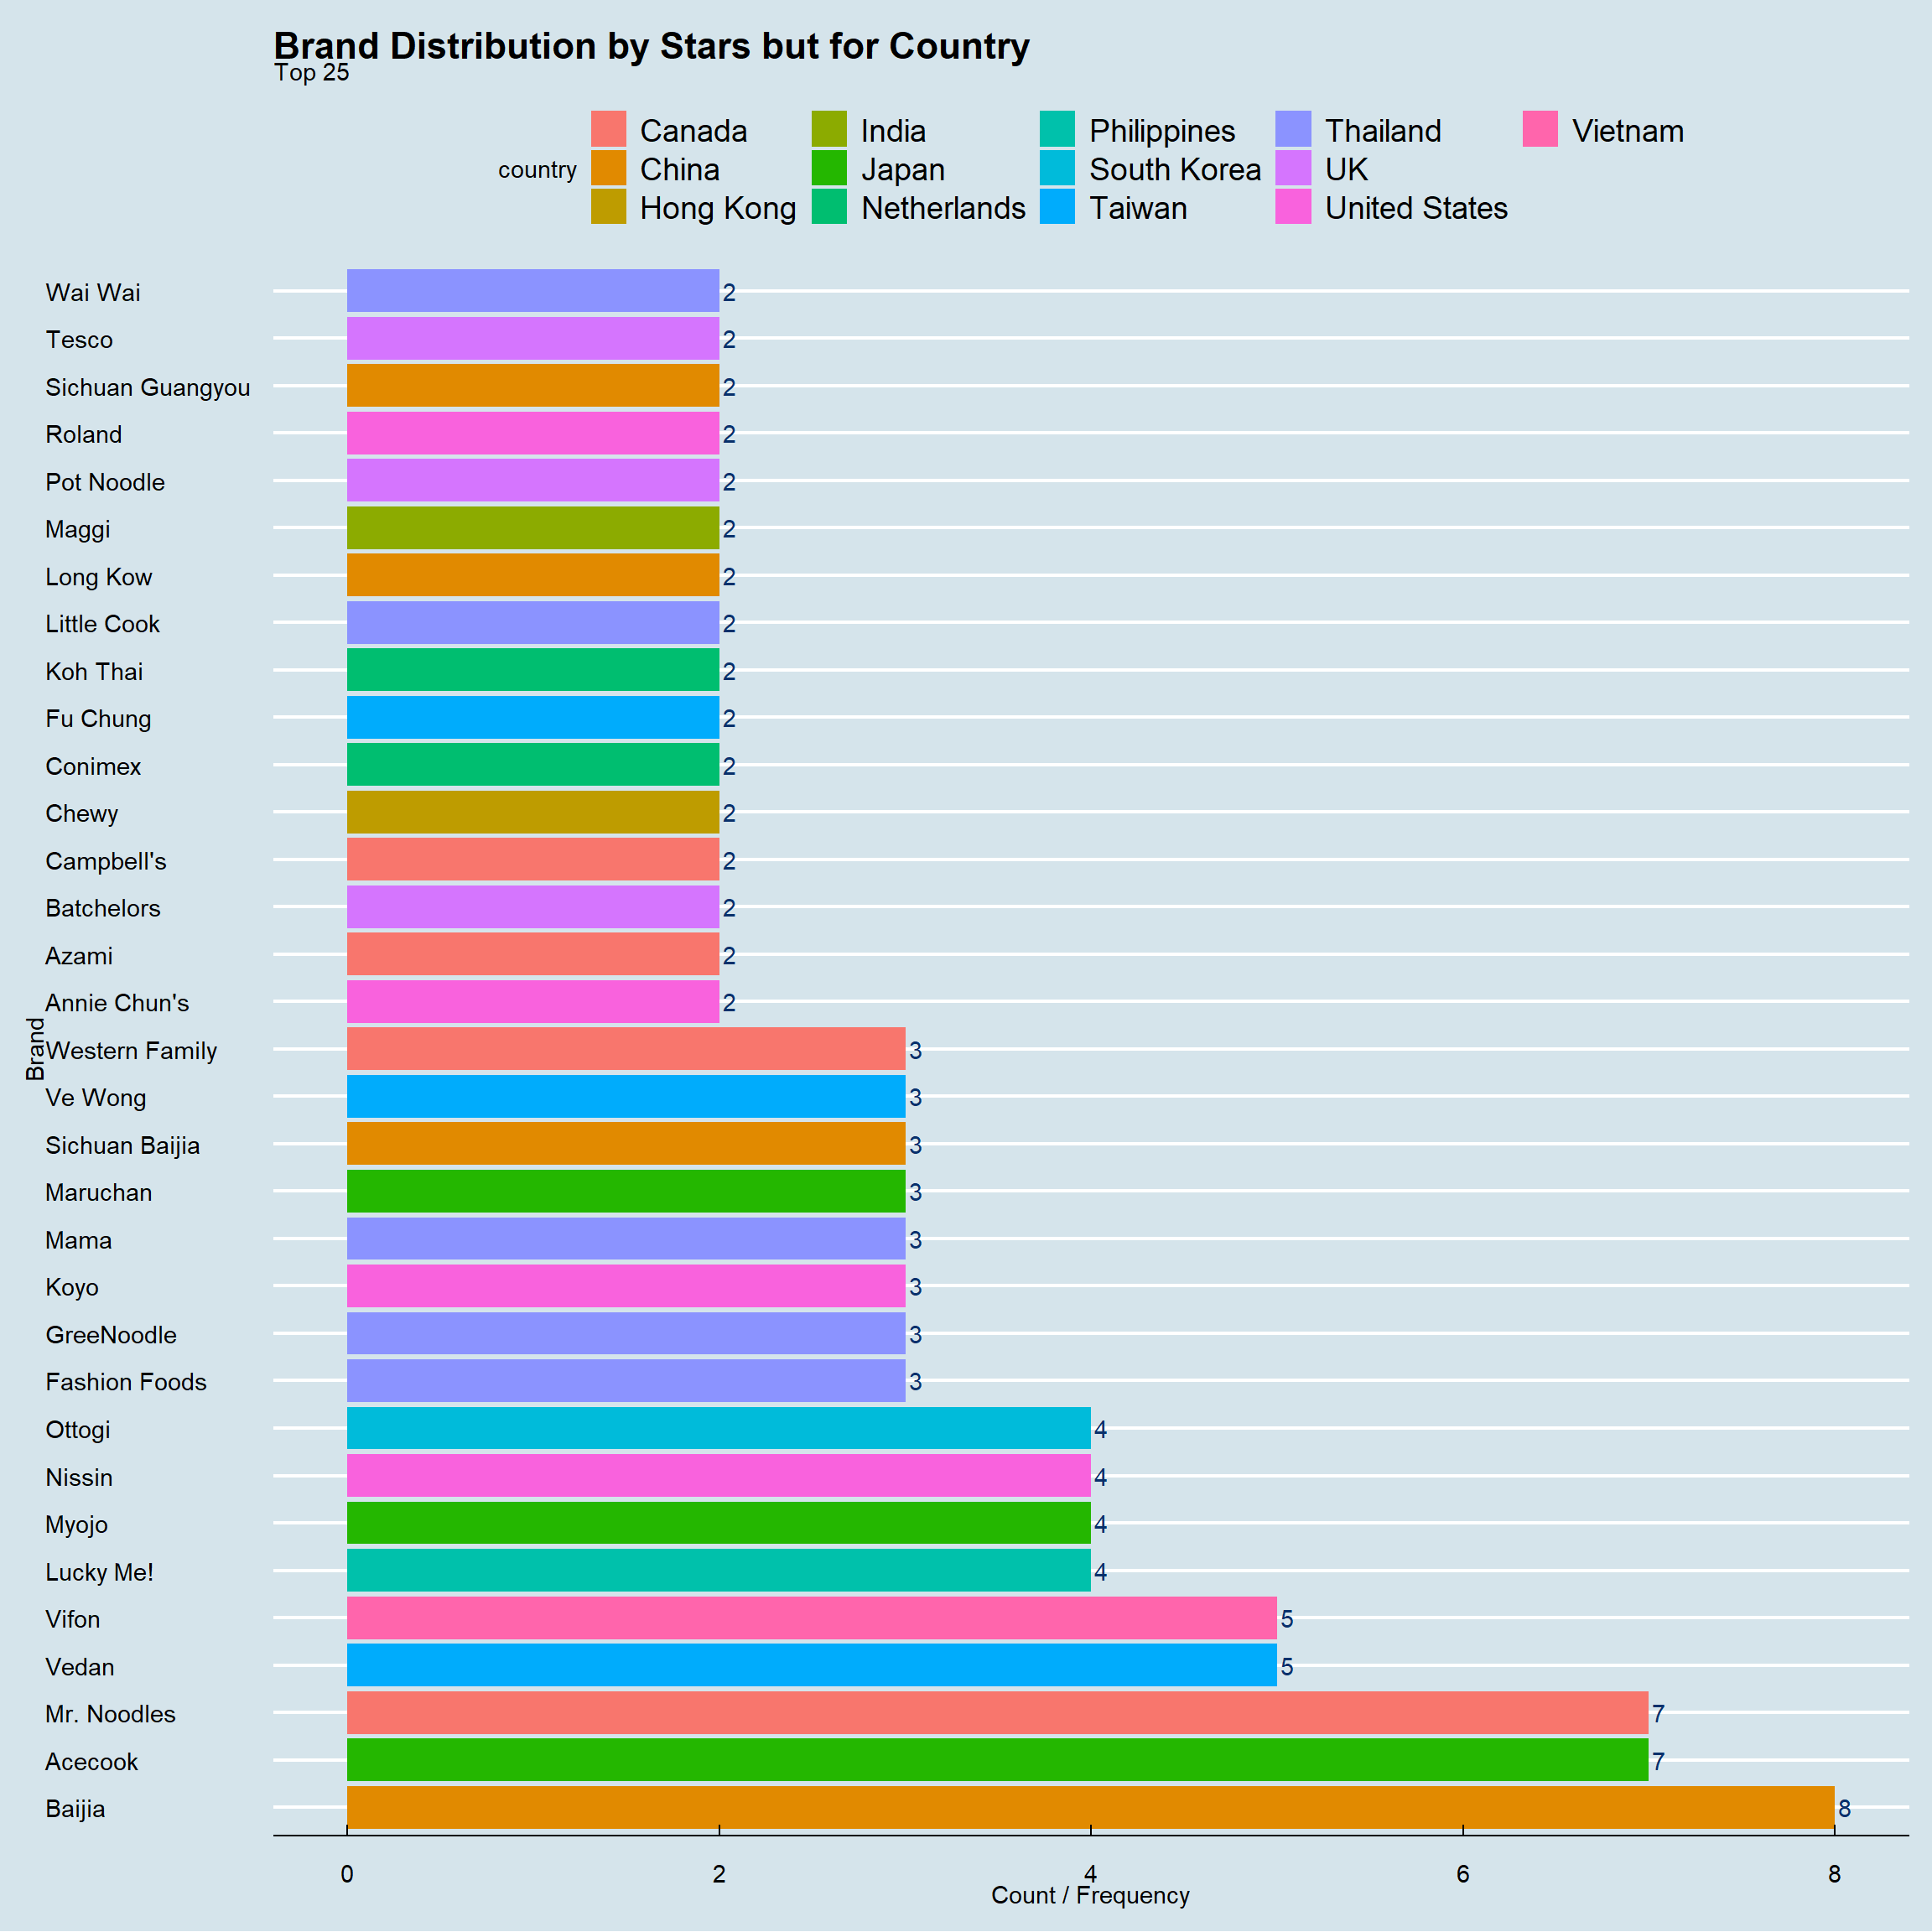
Style and Country versus Stars
Rating where stars is 4 or above 4
ramen_ratings %>%
  subset(stars >=4)%>%
  count(style,country,sort = TRUE) %>%
  top_n(25) %>%
ggplot(.,aes(x=fct_inorder(country),y=n,label=n,fill=style))+
      geom_col(position = "dodge")+
      ylab("Count / Frequency")+xlab("Country")+
      geom_text(hjust=-0.25,color=blues9[9],
                position = position_dodge(width = 1))+
      ggtitle("Style Distribution by Stars but for Country",
              subtitle = "Top 25")+
      theme_economist()+ coord_flip()
Rating where stars is below 2
ramen_ratings %>%
  subset(stars <2)%>%
  count(style,country,sort = TRUE) %>%
  top_n(25) %>%
ggplot(.,aes(x=fct_inorder(country),y=n,label=n,fill=style))+
      geom_col(position = "dodge")+
      ylab("Count / Frequency")+xlab("Country")+
      geom_text(hjust=-0.25,color=blues9[9],
                position = position_dodge(width = 1))+
      ggtitle("Style Distribution by Stars but for Country",
              subtitle = "Top 25")+
      theme_economist()+ coord_flip()
Brand, Style and Country versus Stars
Rating where stars is 4 or above 4
ramen_ratings %>%
  subset(stars >=4)%>%
  count(brand,style,country,sort = TRUE) %>%
  top_n(25) %>%
ggplot(.,aes(x=country,y=n,label=n,fill=style))+
      geom_col(position = "dodge")+facet_wrap(~brand)+
      ylab("Count / Frequency")+xlab("Country")+
      geom_text(hjust=-0.05,color=blues9[9],size=3.5,
                position = position_dodge(width = 1))+
      ggtitle("Style Distribution by Stars but for Country",
              subtitle = "Top 25")+
      theme_economist()+ coord_flip()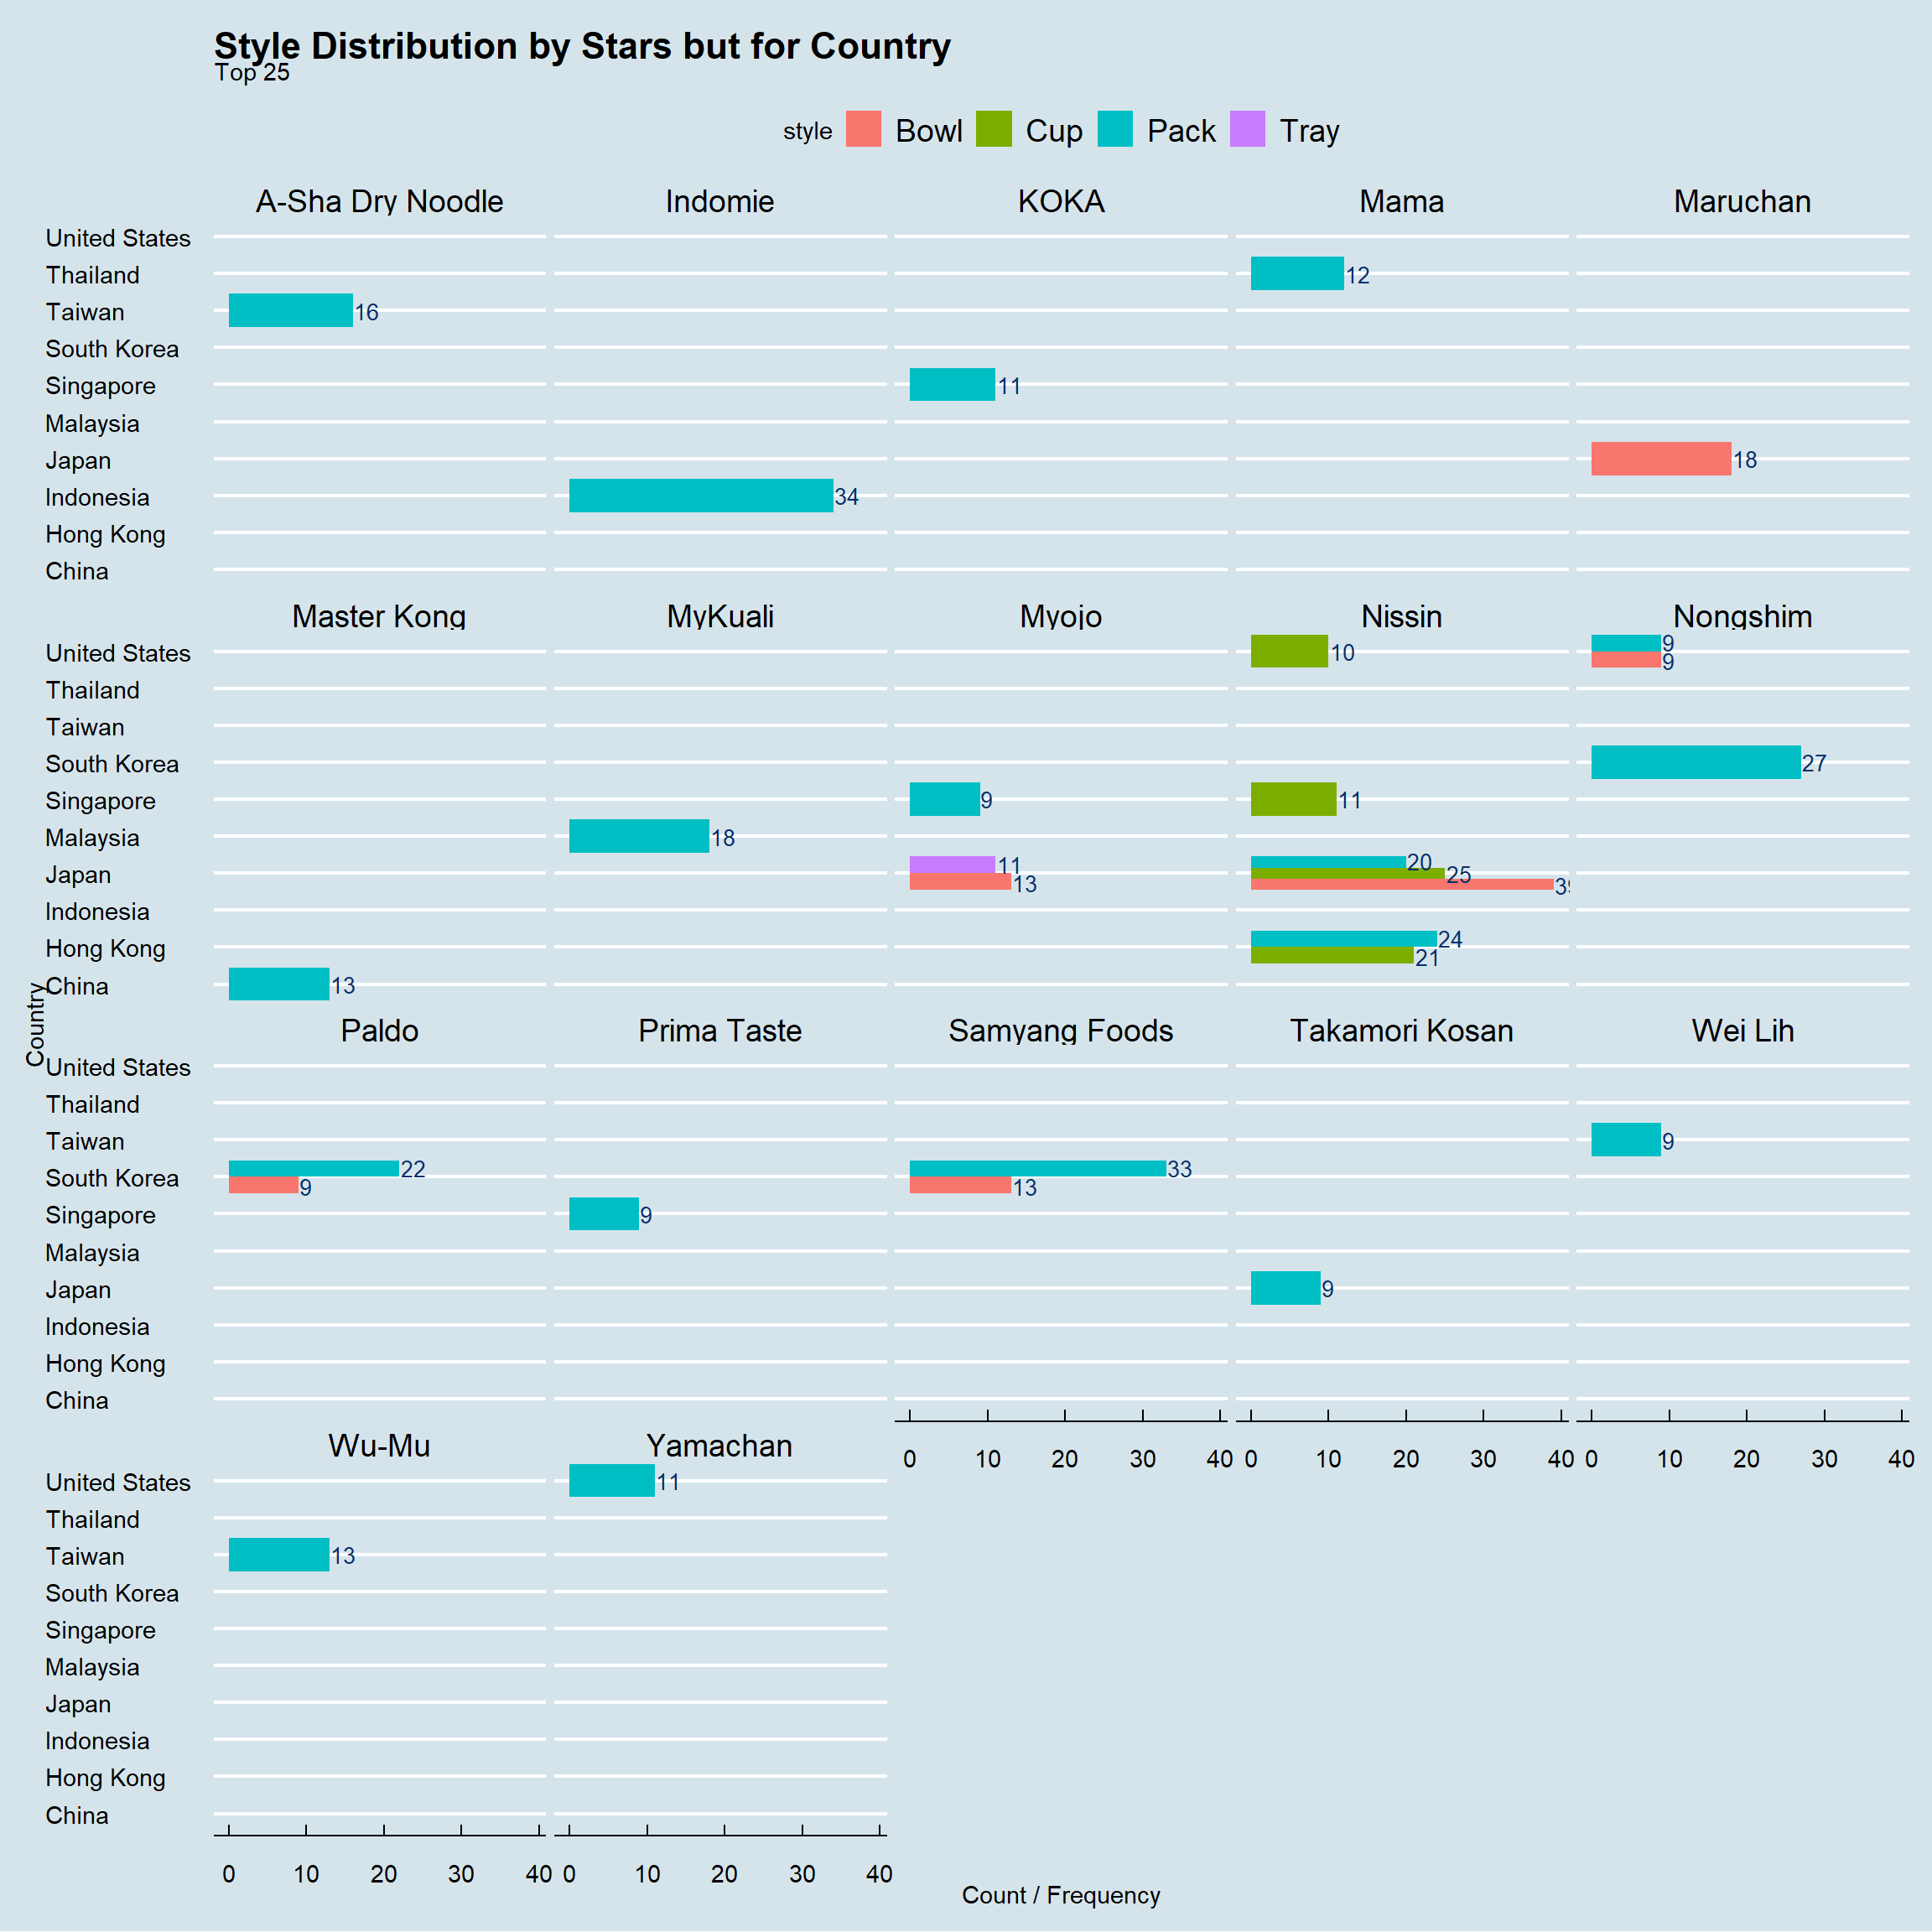
Rating where stars is below 2
ramen_ratings %>%
  subset(stars <2)%>%
  count(brand,style,country,sort = TRUE) %>%
  top_n(25) %>%
ggplot(.,aes(x=country,y=n,label=n,fill=style))+
      geom_col(position = "dodge")+facet_wrap(~brand)+
      ylab("Count / Frequency")+xlab("Country")+
      geom_text(hjust=-0.05,color=blues9[9],size=3.5,
                position = position_dodge(width = 1))+
      ggtitle("Style Distribution by Stars but for Country",
              subtitle = "Top 25")+
      theme_economist()+ coord_flip()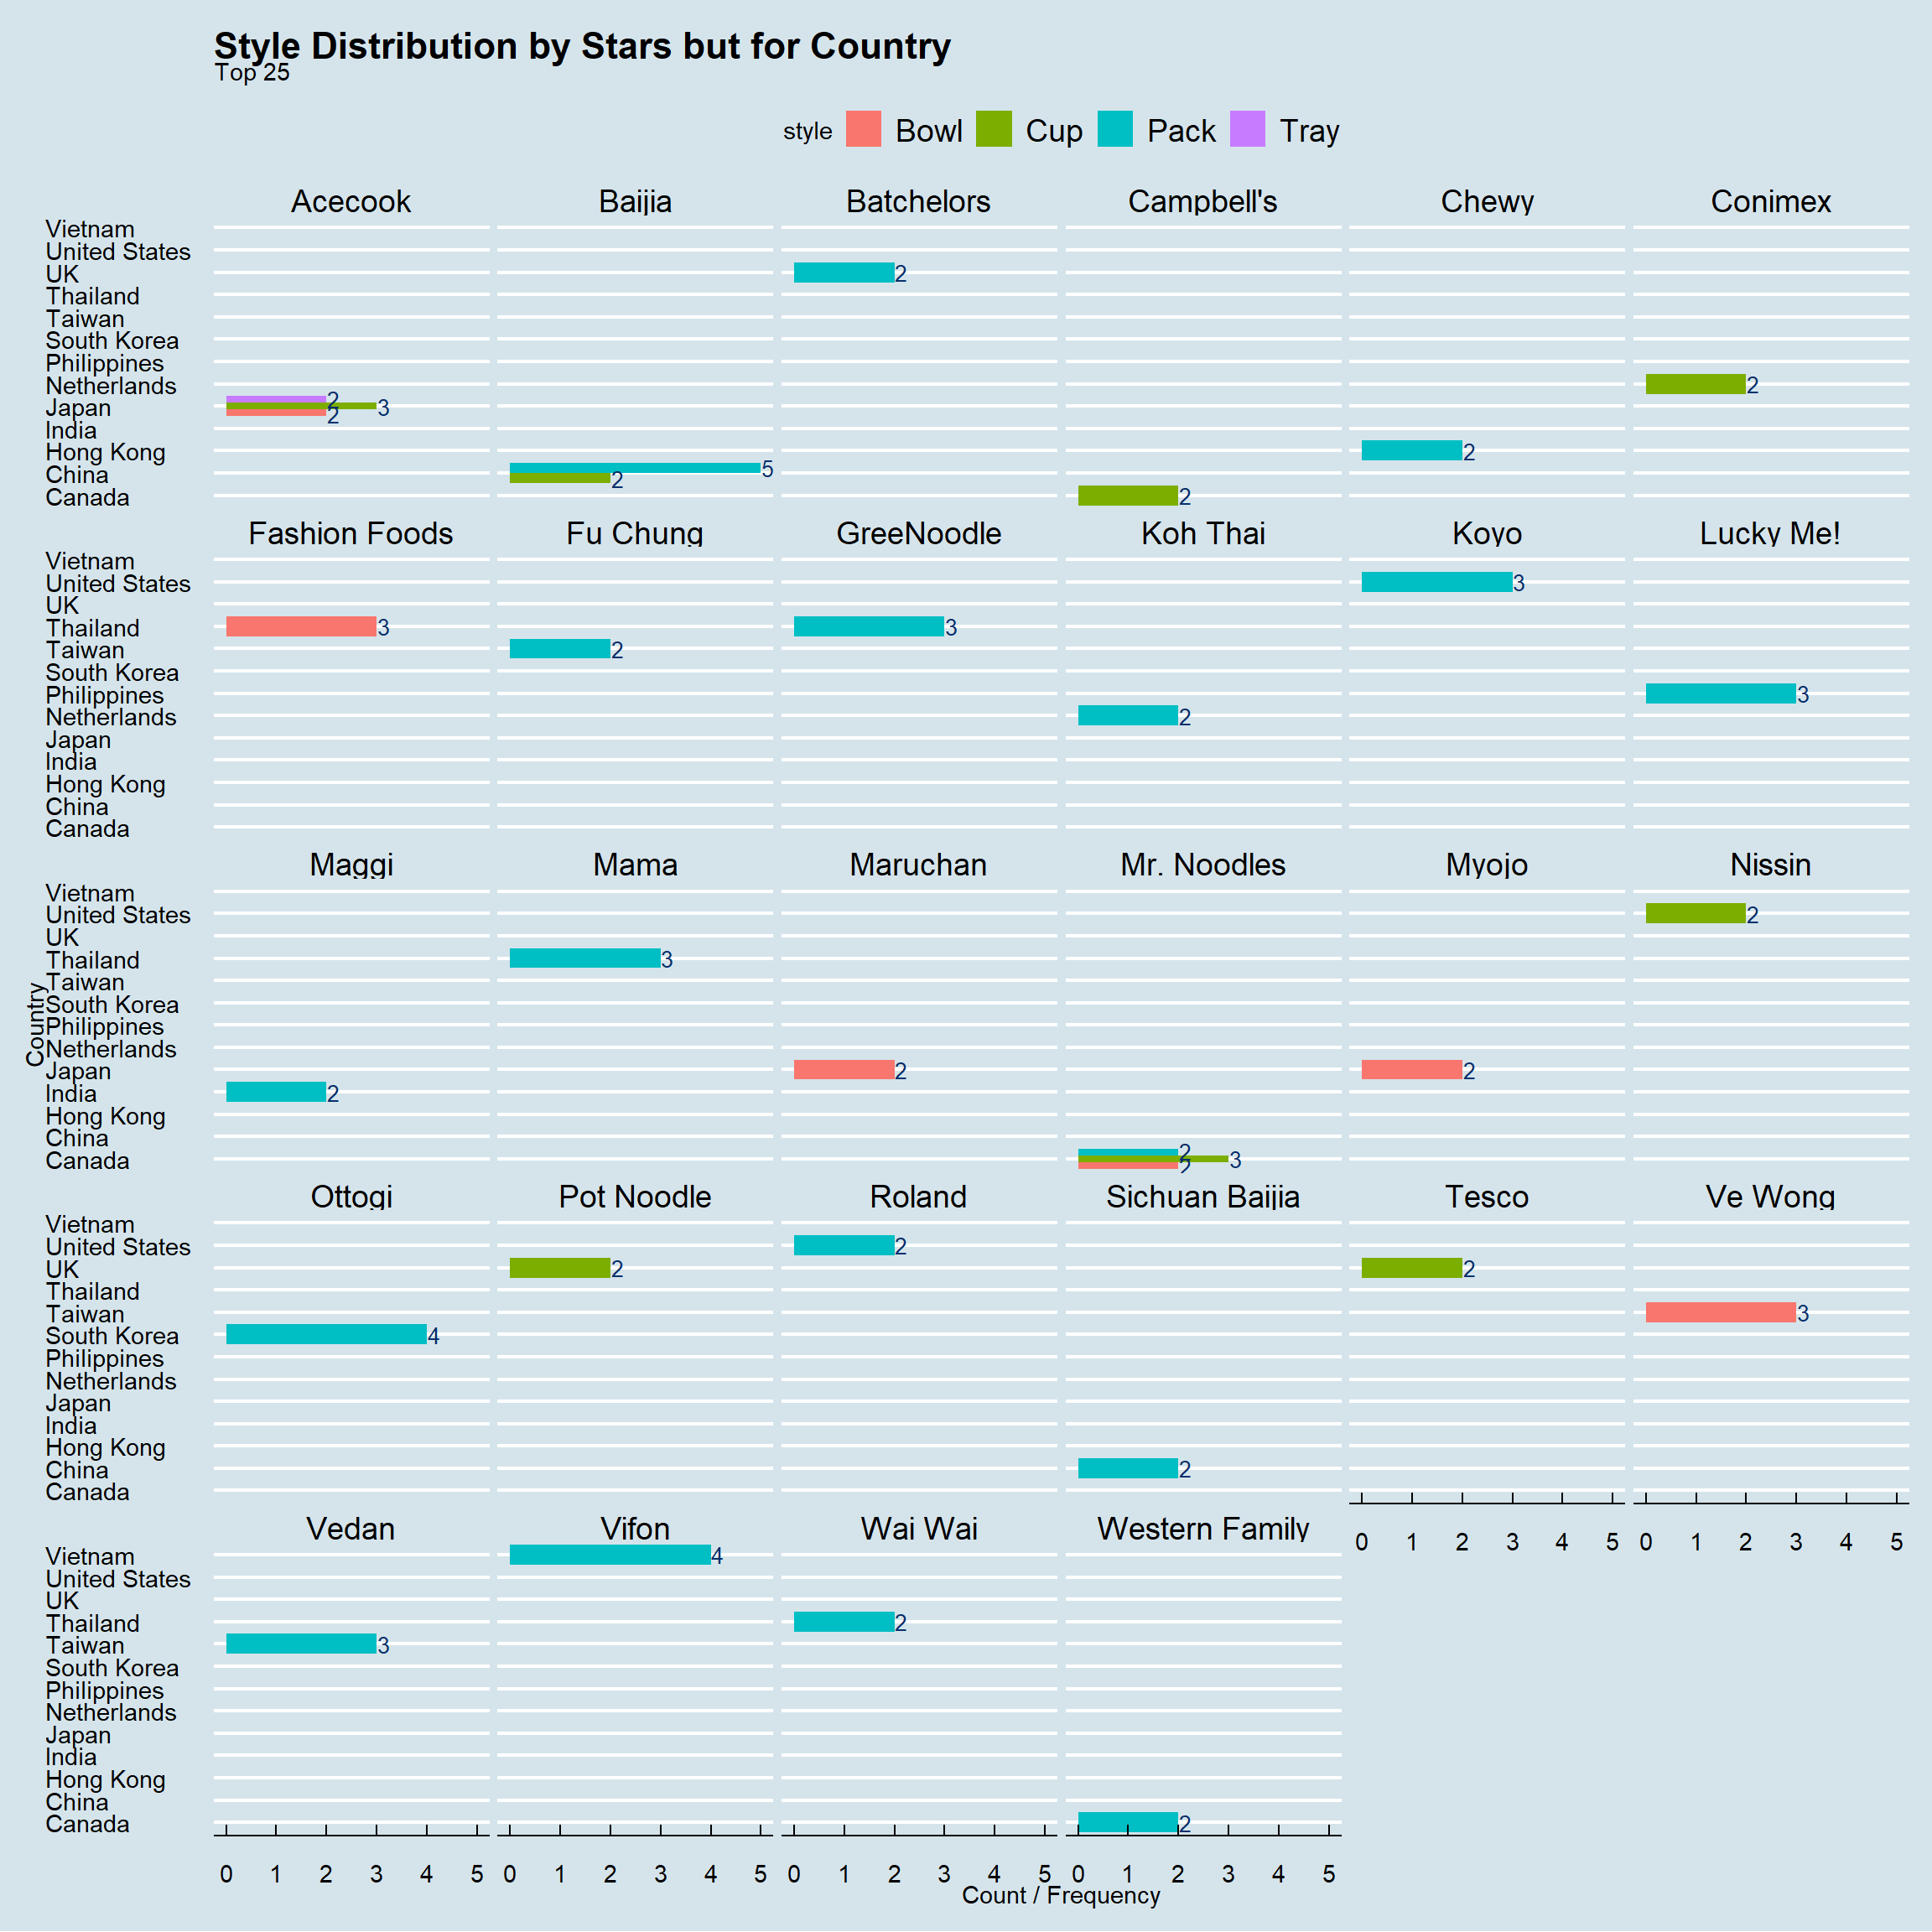
Special Plot
#summarytools::dfSummary(ramen_ratings)

spe_plot<-ramen_ratings %>%
          subset(brand=="Nissin" | brand=="Nongshim" |
                 brand=="Maruchan" | brand=="Myojo" |
                 brand=="Samyang Foods" | brand=="Mama"|
                 brand=="Paldo" | brand=="Indomie"|
                 brand=="Ottogi" | brand=="Sapporo Ichiban") %>%
                 remove_missing() %>%
          ggplot(.,aes(brand,as_factor(stars),color=style))+
          geom_jitter()+theme_economist()+
          xlab("Brand")+ylab("Stars")+
          ggtitle("How Stars change for Brands",subtitle="{closest_state}")+
          transition_states(country,transition_length = 1,state_length = 2)+
          enter_fade()+exit_fade()

animate(spe_plot,nframes=44,fps=2)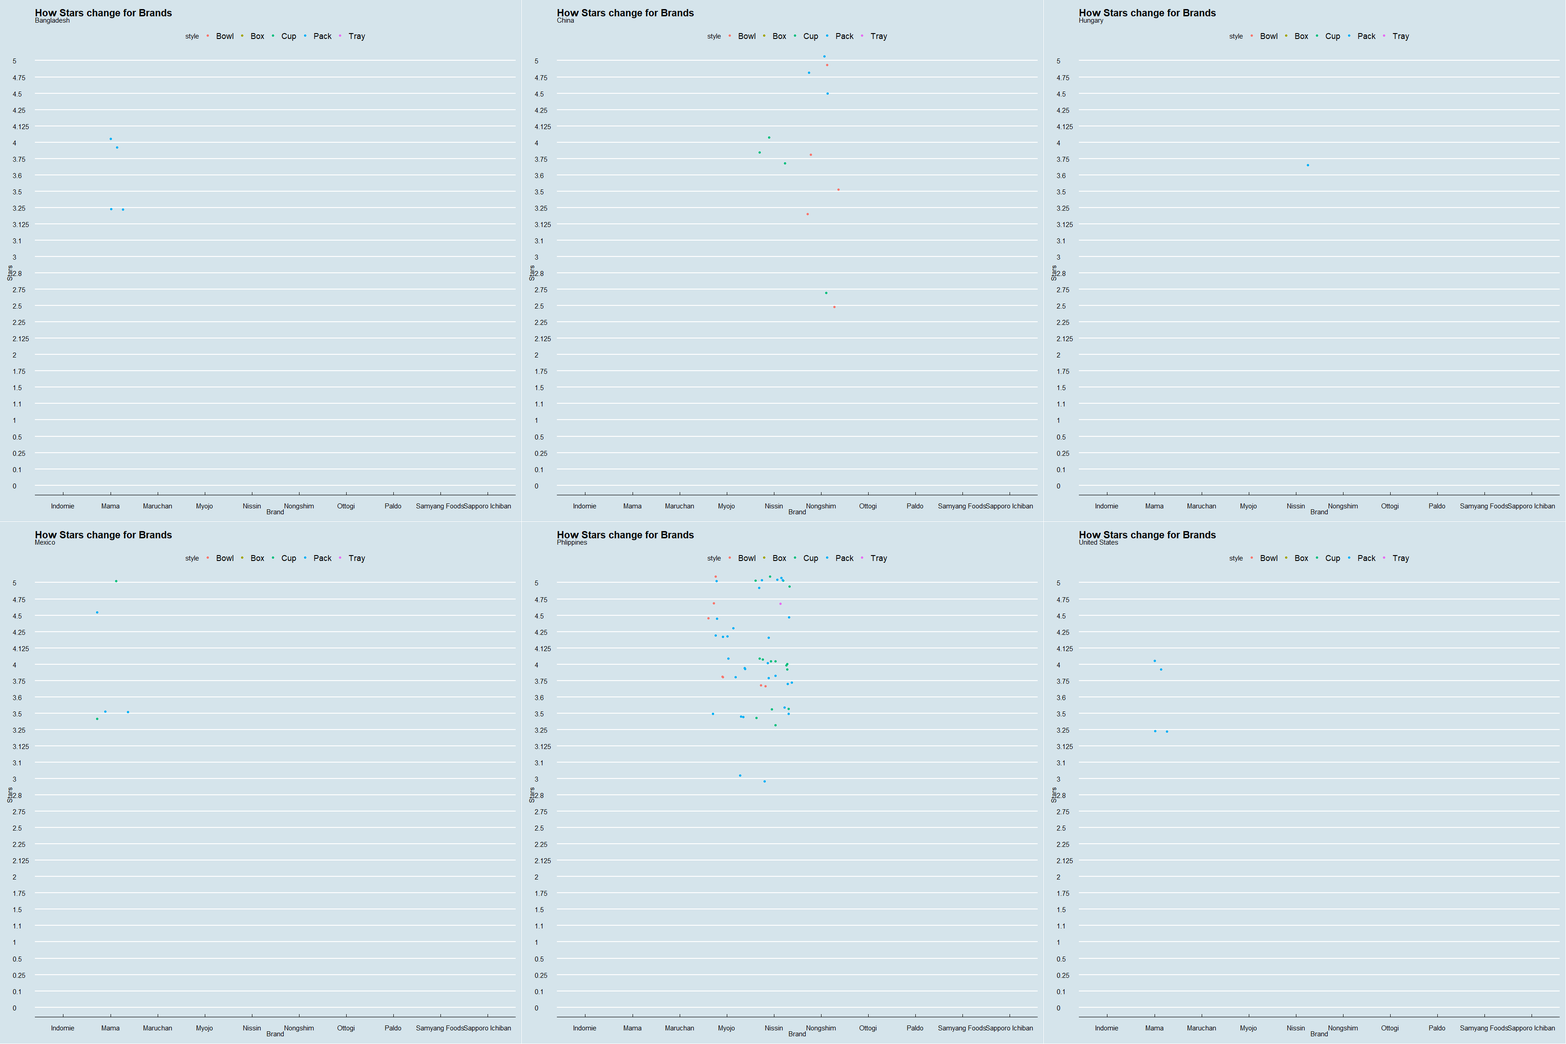
THANK YOU